Technical analysis by MonoCoinSignal about Symbol BTC: Sell recommendation (12/7/2025)

MonoCoinSignal
بیت کوین در آستانه سقوط؟ نشانههای هشداردهنده بازار که نباید نادیده بگیرید!
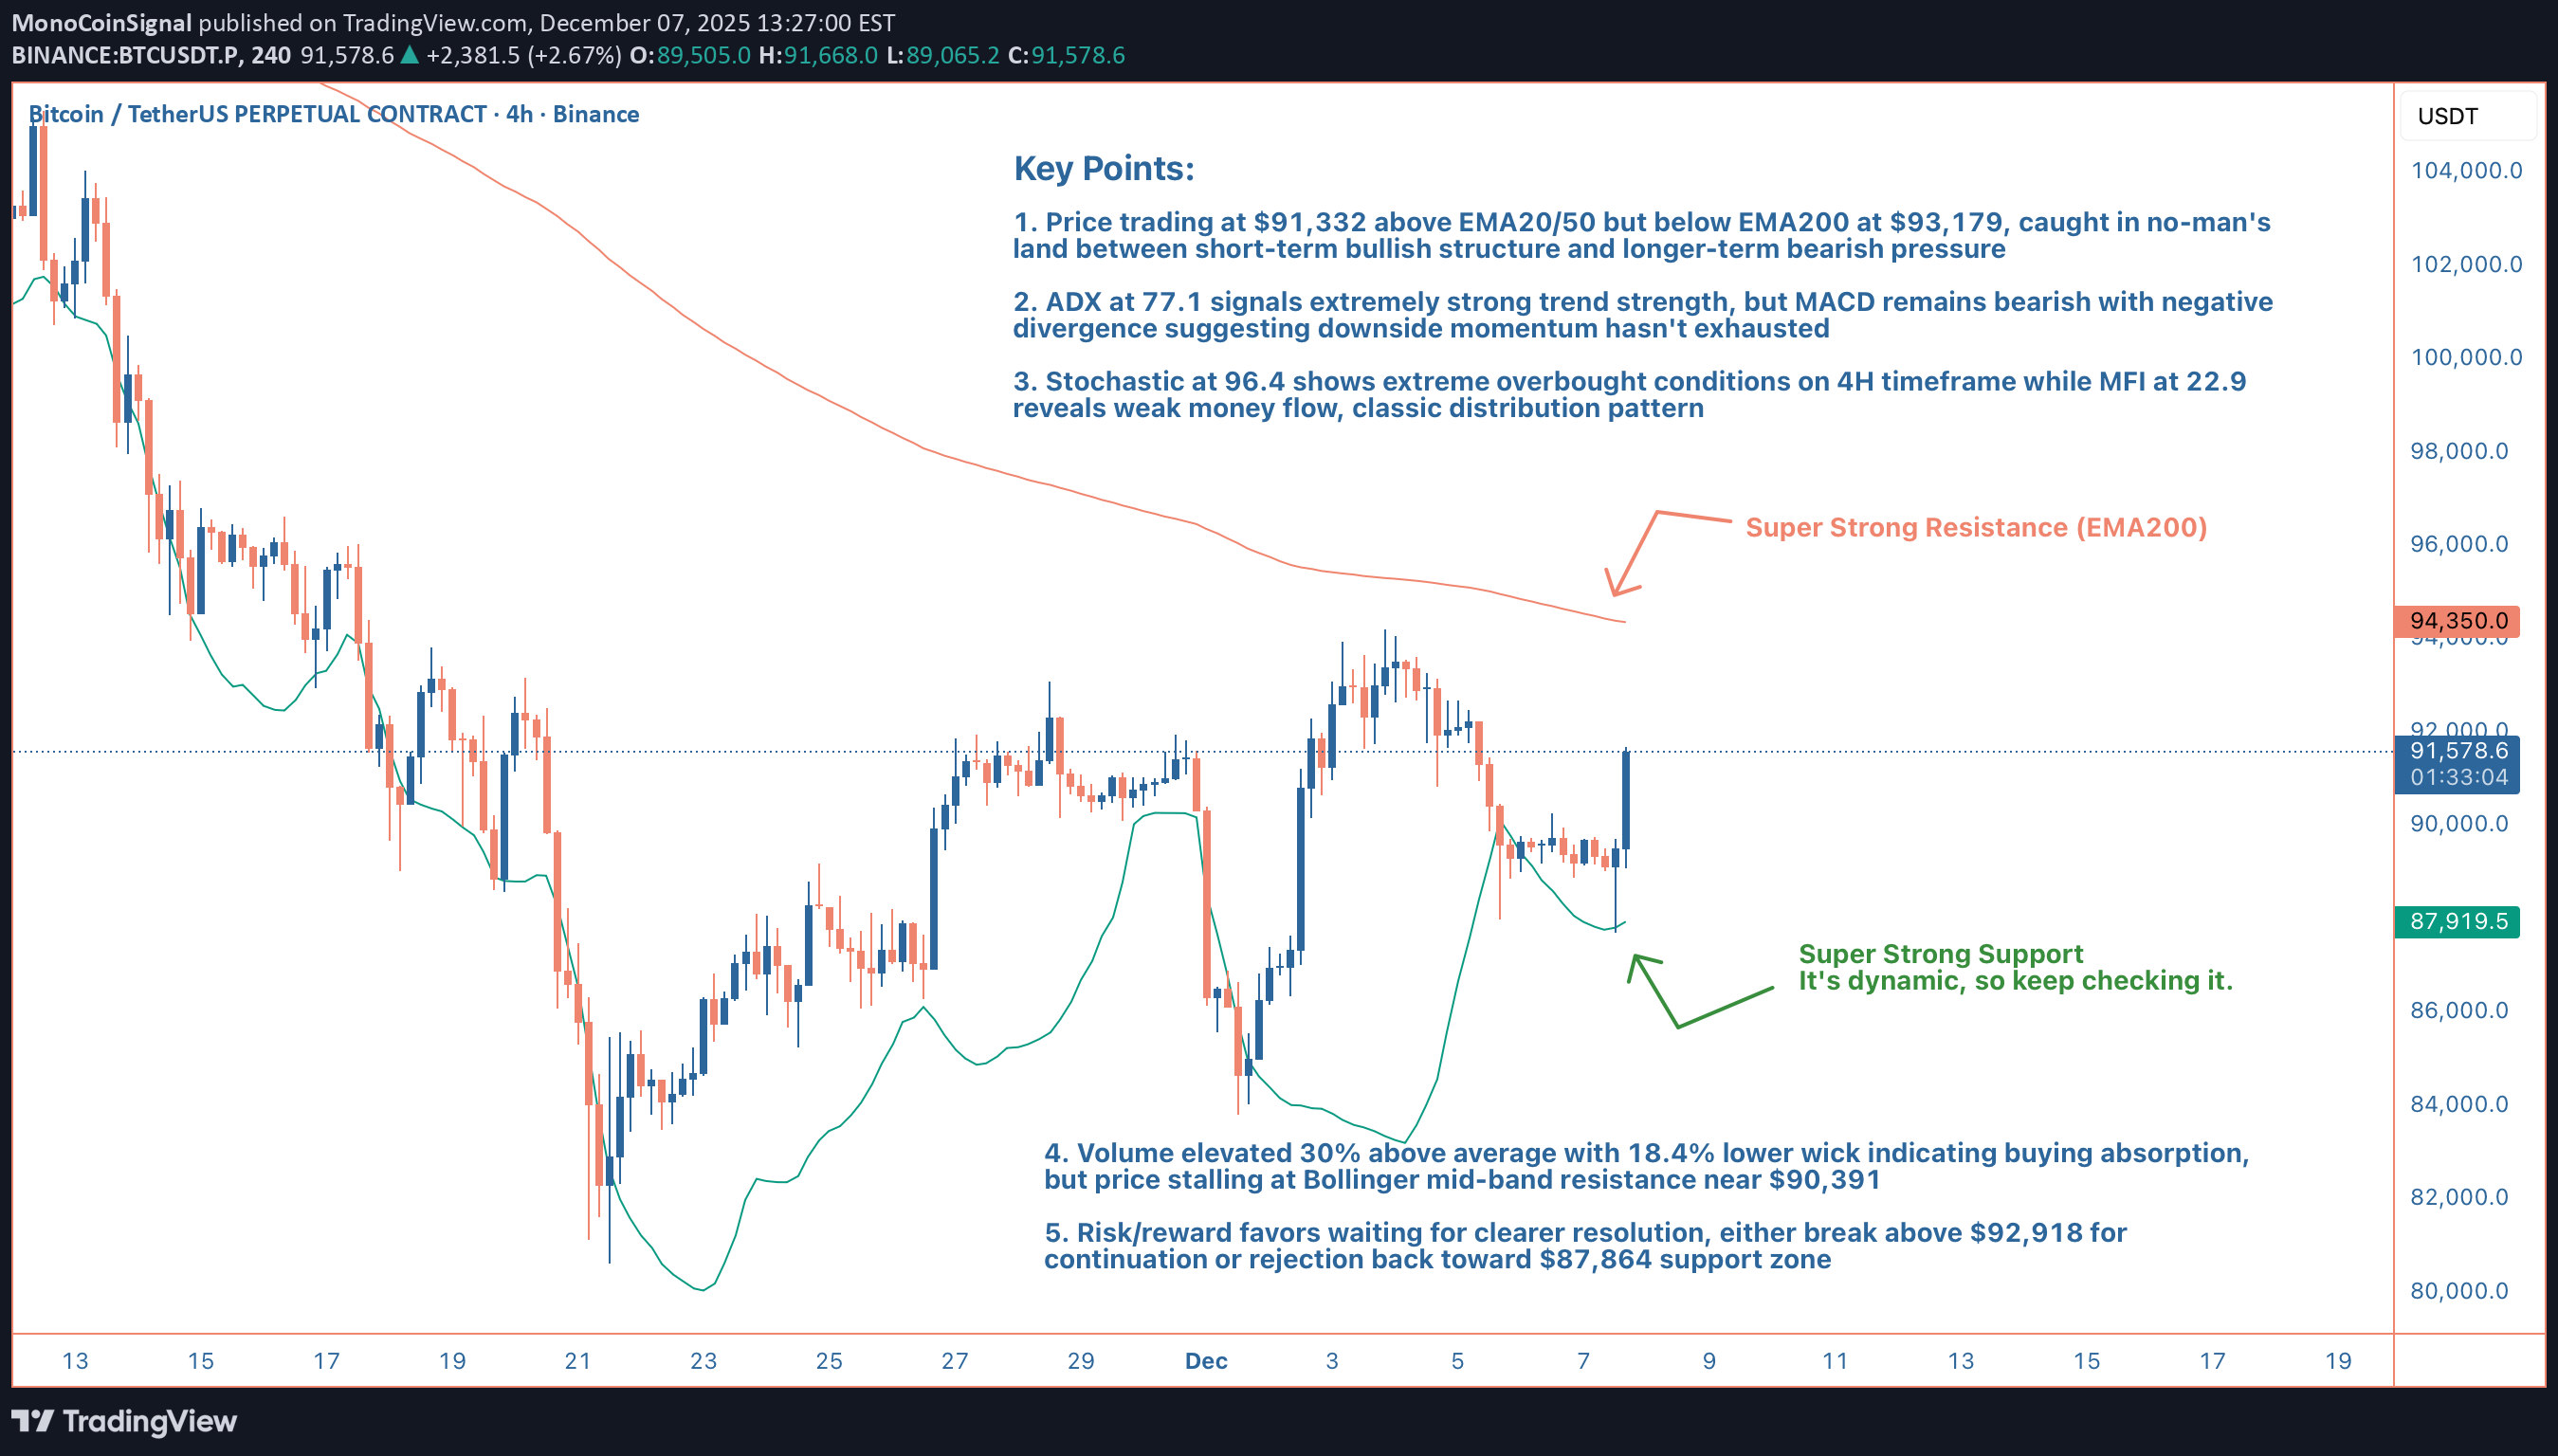
Hey guys, Bitcoin on the 4H is setting up what looks like a textbook distribution pattern, and I'm leaning bearish here despite the recent bounce off $87,688. Price is currently trading at $91,332, sitting in a really uncomfortable middle zone. We're above the short-term moving averages (EMA20 at $90,193 and EMA50 at $90,276), which on the surface looks bullish. But here's the problem: we're still firmly rejected below the EMA200 at $93,179, and that level's been acting as a ceiling for multiple sessions now. Every time we push toward $92,900-$93,200, sellers step in hard. That's your primary supply zone, and it's reinforced by the Bollinger Band upper limit at $92,918. The indicator stack is where things get really interesting. ADX is screaming at 77.1, that's extreme trend strength, folks. But which trend? The MACD is still bearish at -286.85 versus signal at -284.68, telling us the momentum remains to the downside despite this bounce. More importantly, check out the Stochastic at 96.4, that's massively overbought on the 4H timeframe. When you see Stochastic that extended, you're usually near a local top, not the beginning of a rally. Here's where it gets spicy: the MFI is sitting at just 22.9. Let that sink in. Price is pushing higher, Stochastic is overbought, but money flow is absolutely anemic. That's classic divergence, price going up on declining participation. Smart money's distributing into strength while retail's buying the breakout. I've seen this movie before, and it doesn't end well for late buyers. Volume analysis supports the bearish thesis. We're running 30% above average at $26,852, which confirms active participation. But notice the wick structure: 18.4% lower wick shows buyers stepped in aggressively, yet we've got a 5.6% upper wick showing sellers immediately absorbed that pressure. In a healthy uptrend, you want to see small upper wicks and strong closes. This candle structure screams exhaustion. From a structural perspective, we've formed a higher low (bullish), but we haven't confirmed a higher high yet (neutral to bearish). That makes this a potential bear flag rather than a reversal pattern. The Bollinger Bands are telling a similar story, we're trading just above the middle band at $90,391, but we haven't been able to sustain any momentum toward the upper band. That middle band is now acting as resistance rather than support, which is a bearish flip. Support levels to watch: immediate support sits at the HMA55 around $90,540, then the EMA20 at $90,193. If those break, we're looking at a quick move back to the lower Bollinger Band at $87,864, which aligns with today's low of $87,688. That zone saw significant buying interest earlier, so it should provide a bounce, but if it fails, we could see acceleration toward the $86,200-$85,500 range where weekly support clusters. Resistance is clearly defined: $92,918 (Bollinger upper), $93,179 (EMA200), and $93,500 (psychological). Any sustained move above $93,200 would invalidate this bearish setup and suggest we're heading for price discovery toward the $95,000 zone. But with current momentum and indicator readings, I'm assigning less than 30% probability to that scenario. Trading setup: I'm looking at short entries in the $89,800-$90,500 range if we get a lower high formation on the 1H chart. Stop loss goes above $92,500 to give room for a false breakout. Targets are $87,800 (TP1), $86,200 (TP2), and $85,000 (TP3) for the aggressive traders. Risk/reward on this is roughly 1:2.5 to first target, which is acceptable given the confluence of bearish signals. The internal market state shows bullish bias but only 38.6% directional confidence, that's essentially a coin flip, and when the algos are this uncertain, I fade the recent move. The 6-2 bull-bear stack sounds bullish until you realize that's only 75% agreement, and with ADX this high, we need near-unanimous confirmation for continuation. Bottom line: this looks like a corrective bounce within a larger downtrend rather than the start of a new leg up. The combination of overbought Stochastic, weak money flow, bearish MACD, and resistance cluster overhead tilts the probabilities toward downside resolution. I'm giving this a 68% confidence bearish call, not slam-dunk territory, but enough edge to take a position with proper risk management. What are you guys seeing here? Are you fading this bounce or waiting for confirmation above $93,200?