Technical analysis by jimmyak_1975 about Symbol BTC: Sell recommendation (11/30/2025)

فشار نهایی بیت کوین: آیا ریزش بزرگ در راه است یا جهش به 100 هزار دلار؟
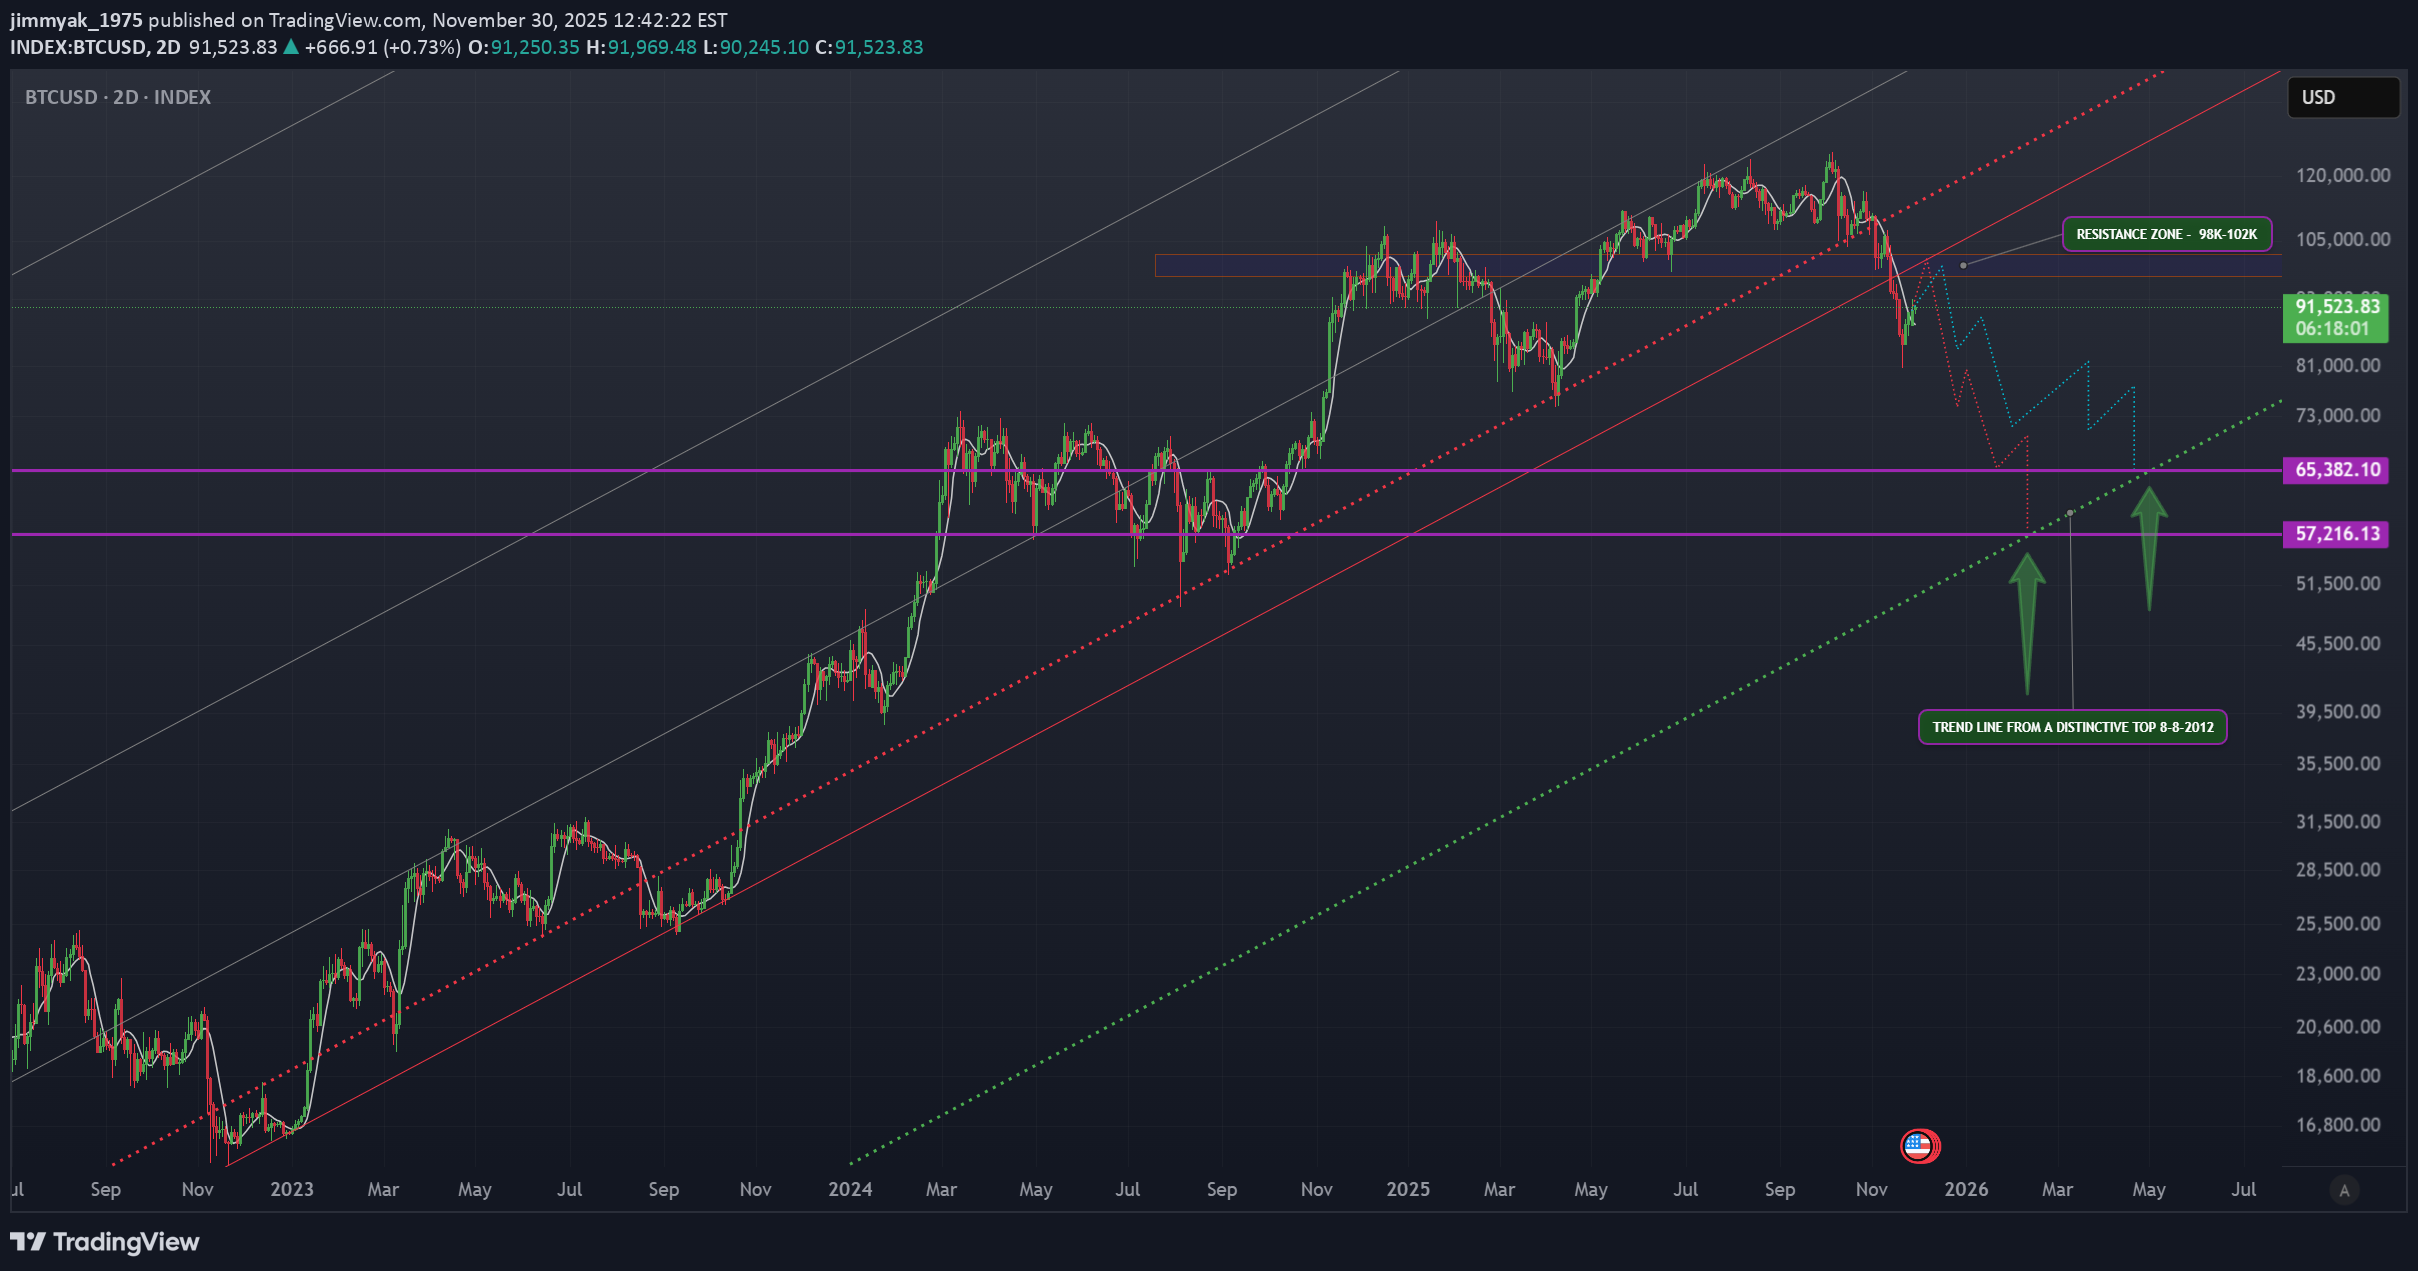
As a start we have an obvious break of the red dotted diagonal line that is traced way back with solid connected bottoms. this is a very strong bearish signal in itself. a limited 35% drop from the top with such a strong break is highly improbable. a continuation towards lower support zones is a normal extension of that initial drop. Using Diagonal Trend lines that are connected through several key bottoms and tops, along with other indicators, we can expect a retest of resistance = 98k-102k most probably close to 98k. A bounce down follows with 2 possibilities of landing zones, 65k or 57k . both are good candidates for a rebound up & a start of a bullish trend. The green dotted line can be traced back to 8/8/2012 from a very distinctive Top (it's actually a zone). This might be as far as you can go away from traditional trading analysis, but sometimes thinking out of the box can help reveal info hidden in plain site.