Technical analysis by StudyGuideTA about Symbol BTC on 11/17/2025
StudyGuideTA
تحلیل تکنیکال بیت کوین 4 ساعته: راز سطوح حمایت و مقاومت (BS/FS) کشف شد!
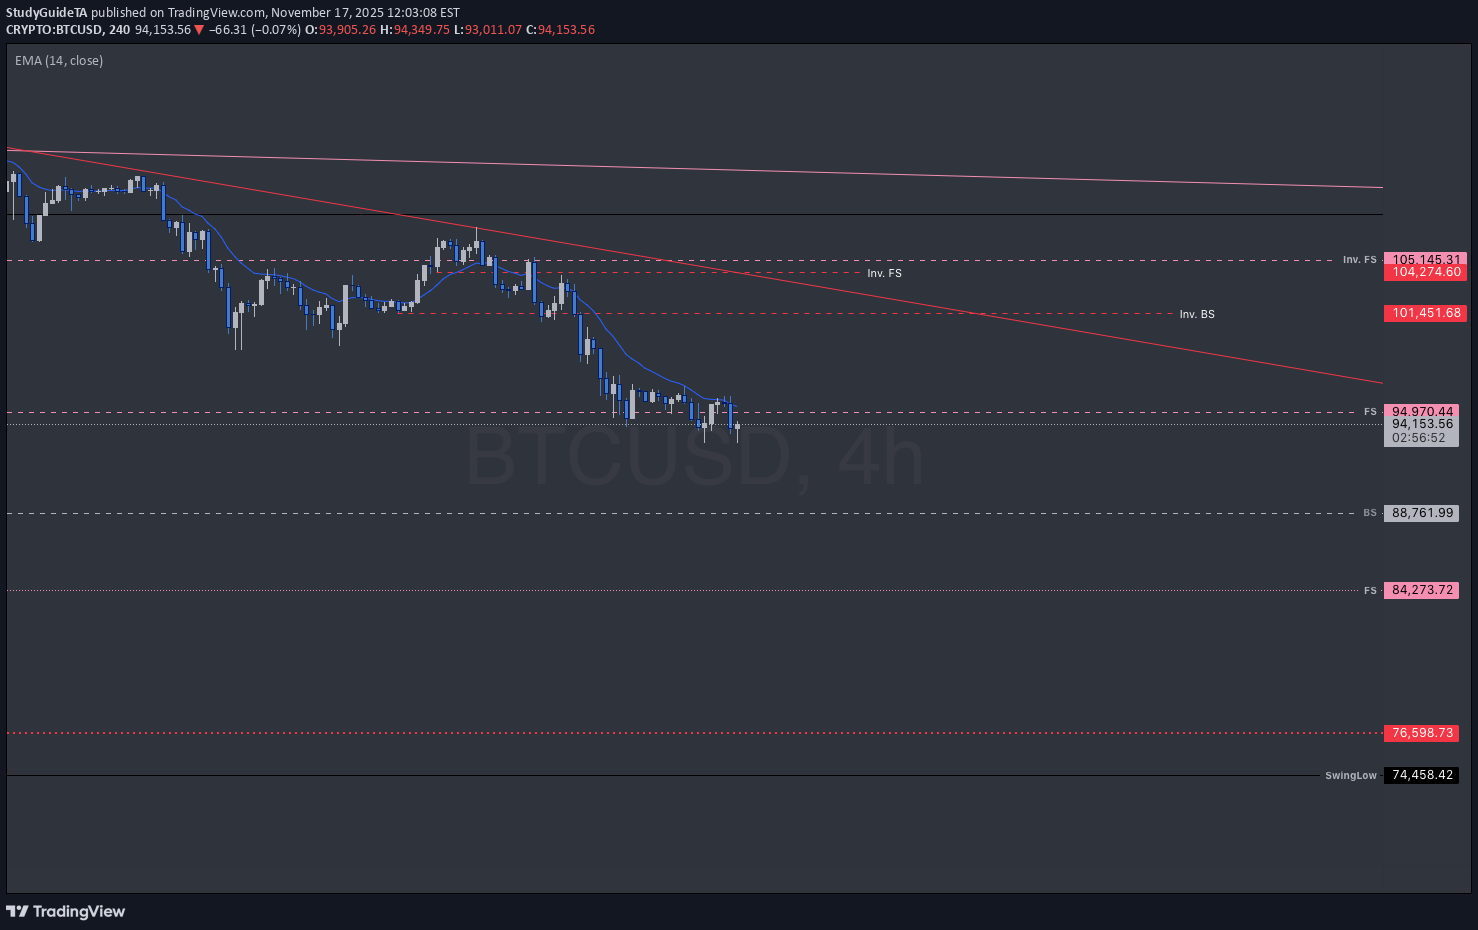
T.A explained - BackSide (BS) FrontSide (FS) Inverse BS (Inv.BS) Inverse FS (Inv.FS) BS & FS levels are expected support when dashed lines, tested when dotted and resistance when solid lines. The inverse is true for the Inv. BS Inv. FS levels, they are resistance as dashed lines, tested as dotted and support as solid lines. Monthly timeframe is color pink weekly grey daily is red 4hr is orange 1hr is yellow 15min is blue 5min is green if they are shown. strength favors the higher timeframe. 2x dotted levels are origin levels where trends have or will originate. When trends break, price will target the origin of the trend. its math, when the trend breaks, the vertex breaks too so the higher timeframe level/trend that breaks, the more volatility there could be as strength in the orders flow in to fuel the move.The Weekly BackSide level was tested and the expectation of a BackSide level is to see a big reaction to price comparative to the strength of the timeframe tested so a weekly strength should have a big reaction to price enough to make a daily support level within the week so there should be 1hr and 4hr levels of support forming. If not, the level will fail and price will target a lower level or re-test the same level to create an origin; a level where a range trend will originate. Then the process restarts trying to build those lower timeframe levels of support.