Technical analysis by StudyGuideTA about Symbol XDC on 11/10/2025
StudyGuideTA
تحلیل نمودار روزانه XDC: داستانی که شاید هرگز اتفاق نیفتد!
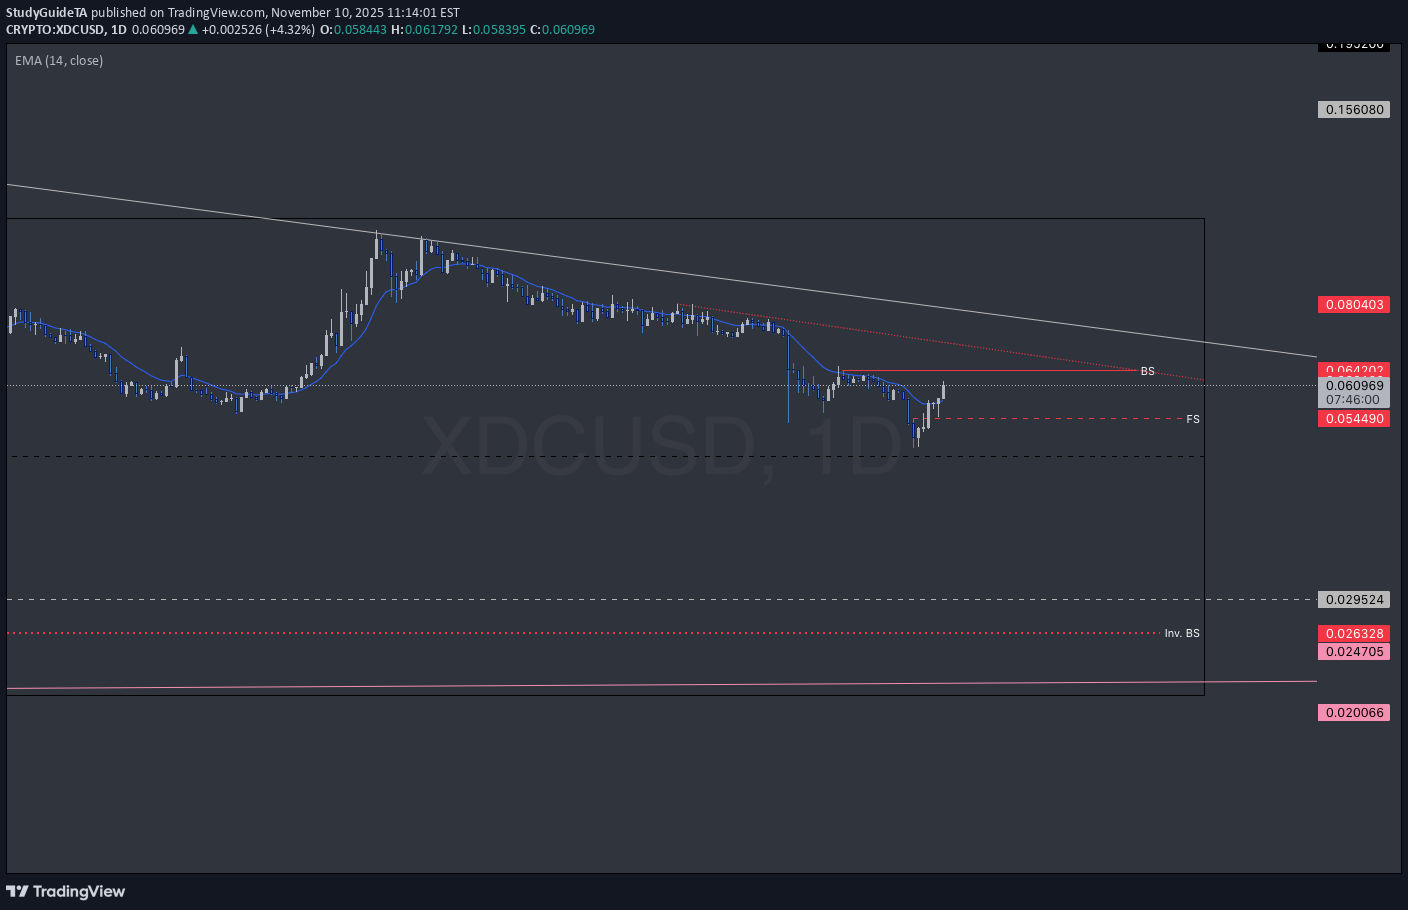
Nothing to see here just a chart about XDC maybe you know about R3, Corda Settler, XRPL, the lawsuit with ripple once upon a time or maybe you just asked Grok to find connections for fundamental research. nothing to see here. though. just a chart illustrating a story that might never happen.the black yearly median level was tested and holding so far. T.A explained - BackSide (BS) FrontSide (FS) Inverse BS (Inv.BS) Inverse FS (Inv.FS) BS & FS levels are expected support when dashed lines, tested when dotted and resistance when solid lines. The inverse is true for the Inv. BS Inv. FS levels, they are resistance as dashed lines, tested as dotted and support as solid lines. Monthly timeframe is color pink weekly grey daily is red 4hr is orange 1hr is yellow 15min is blue 5min is green if they are shown. strength favors the higher timeframe. 2x dotted levels are origin levels where trends have or will originate. When trends break, price will target the origin of the trend. its math, when the trend breaks, the vertex breaks too so the higher timeframe level/trend that breaks, the more volatility there could be as strength in the orders flow in to fuel the move.