Technical analysis by The-Thief about Symbol AAPLX on 11/10/2025

The-Thief
تحلیل تکنیکال اپل (AAPL): آماده شکستن مقاومت یا ریزش بزرگ؟
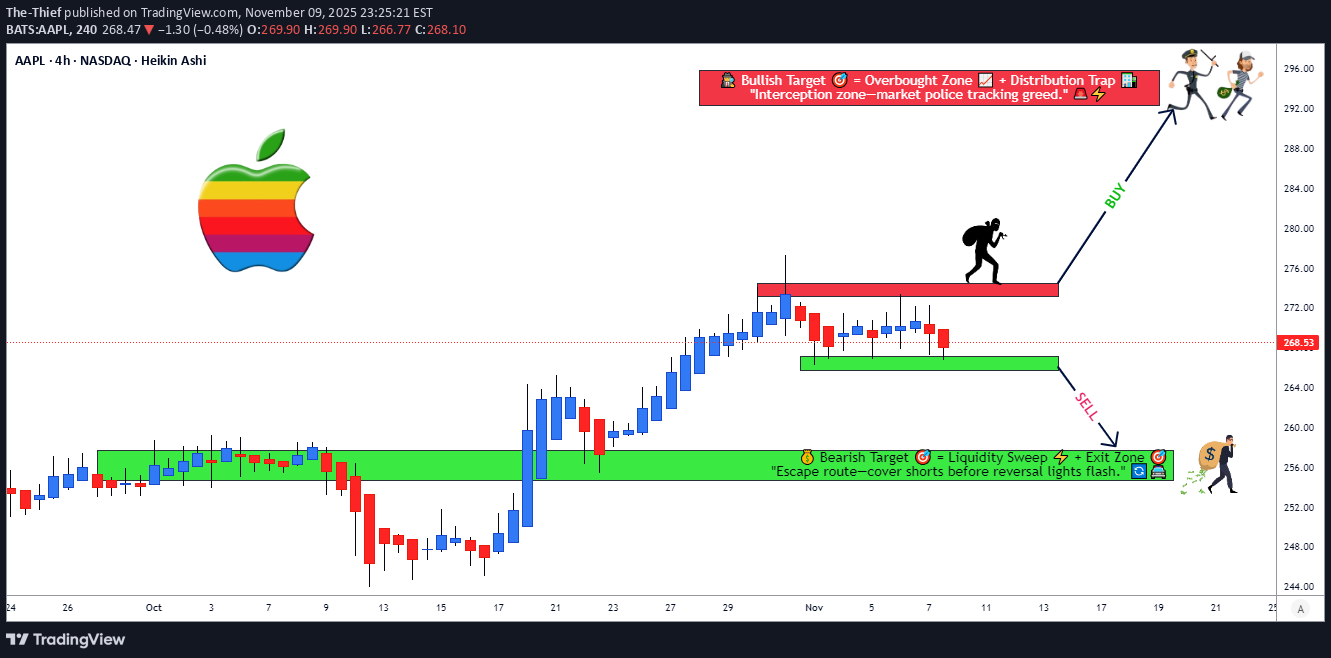
🍎 AAPL | Apple Inc. - Swing Trade Profit Blueprint 💰 NASDAQ: AAPL | Breakout Pattern Setup ⚡ Master the Swing Trade Game 🎯 📊 TECHNICAL OVERVIEW Currently trading at $268.47 with strong momentum indicators aligning for a breakout scenario. Apple is positioned in a critical decision zone with defined technical levels offering professional risk/reward opportunities. 🎲 Market Structure: Tight consolidation phase with multiple confluences at key resistance and support zones. 📈 SWING TRADE SETUP - DUAL SCENARIO ANALYSIS SCENARIO 1: BULLISH BREAKOUT 🚀 Entry Signal: Price breaks above resistance with volume confirmation Entry Zone: Above $272.00 (Daily Close Confirmation) Initial Target: $290.00 TP1 🎯 Extended Target: $295.00 TP2 (Ultimate Profit Zone) 🏆 Stop Loss: $264.00 (Risk Management Point) 🛑 SCENARIO 2: BEARISH BREAKDOWN 📉 Entry Signal: Price breaks below support with selling pressure Entry Zone: Below $266.50 (Daily Close Confirmation) Target 1: $262.00 TP1 🎯 Target 2: $256.00 TP2 (Profit Protection Zone) 🏆 Stop Loss: $276.00 (Risk Management Point) 🛑 🔍 KEY TECHNICAL FACTORS ✅ Momentum Alignment: Multiple timeframe convergence detected ✅ Volume Profile: Above average volume supporting breakout potential ✅ Support/Resistance: Well-defined levels from historical price action ✅ RSI Positioning: Neutral to strong momentum setup ✅ Moving Averages: Key dynamic support levels in play 🎯 SCENARIO CORRELATION PAIRS TO MONITOR Primary Correlations: 🔗 MSFT (Microsoft) - Tech sector strength indicator | Tech giants move together | Watch for divergence signals 🔗 QQQ (Nasdaq-100 ETF) - Broader market direction | If QQQ breaks down, AAPL pressure increases | Use as macro confirmation 🔗 VGT (Vanguard Info Tech ETF) - Sector sentiment gauge | Tech rotation plays | Confirms sector health 🔗 IVV (iShares S&P 500 ETF) - S&P 500 correlation | Broad market support/resistance | Risk-on/risk-off indicator 🔗 GLD (Gold) - Risk sentiment inverse correlation | Gold up = Risk-off = Tech pressure | Macro economic climate 📍 IMPORTANT REMINDERS FOR TRADERS Your Entry Is Your Choice ✓ Only enter when YOUR checklist is complete Your Stop Loss Is Your Decision ✓ Set it where YOU feel comfortable with risk Your Take Profit Is Your Call ✓ Exit when your profit target is achieved or thesis breaks Every trader's risk tolerance differs. These levels are technical reference points, not personal recommendations. 🎓 STRATEGY NOTES ✨ Best used on 1H-4H timeframes for swing trading ✨ Volume confirmation is CRITICAL before entries ✨ Wait for candle closes above/below levels - no wick trading ✨ Use this alongside your own technical analysis ✨ Market conditions can invalidate setups rapidly - stay flexible ✨ The breakout zone is where patience rewards traders 💡 CORRELATION SUMMARY Green Lights ✅: When MSFT, QQQ, and VGT all confirm uptrend = Stronger AAPL bullish case Yellow Caution ⚠️: When divergence appears between AAPL and QQQ = Possible reversal warning Red Lights 🔴: When GLD spikes & IVV breaks support = Risk-off environment = Tech pressure incoming ✨ If you find value in my analysis, a 👍 and 🚀 boost is much appreciated — it helps me share more setups with the community!