Technical analysis by Henrybillion about Symbol PAXG on 10/30/2025

Henrybillion
طلا (XAU/USD) در انتظار چه سیگنالی است؟ سطوح حیاتی برای حرکت بعدی طلا
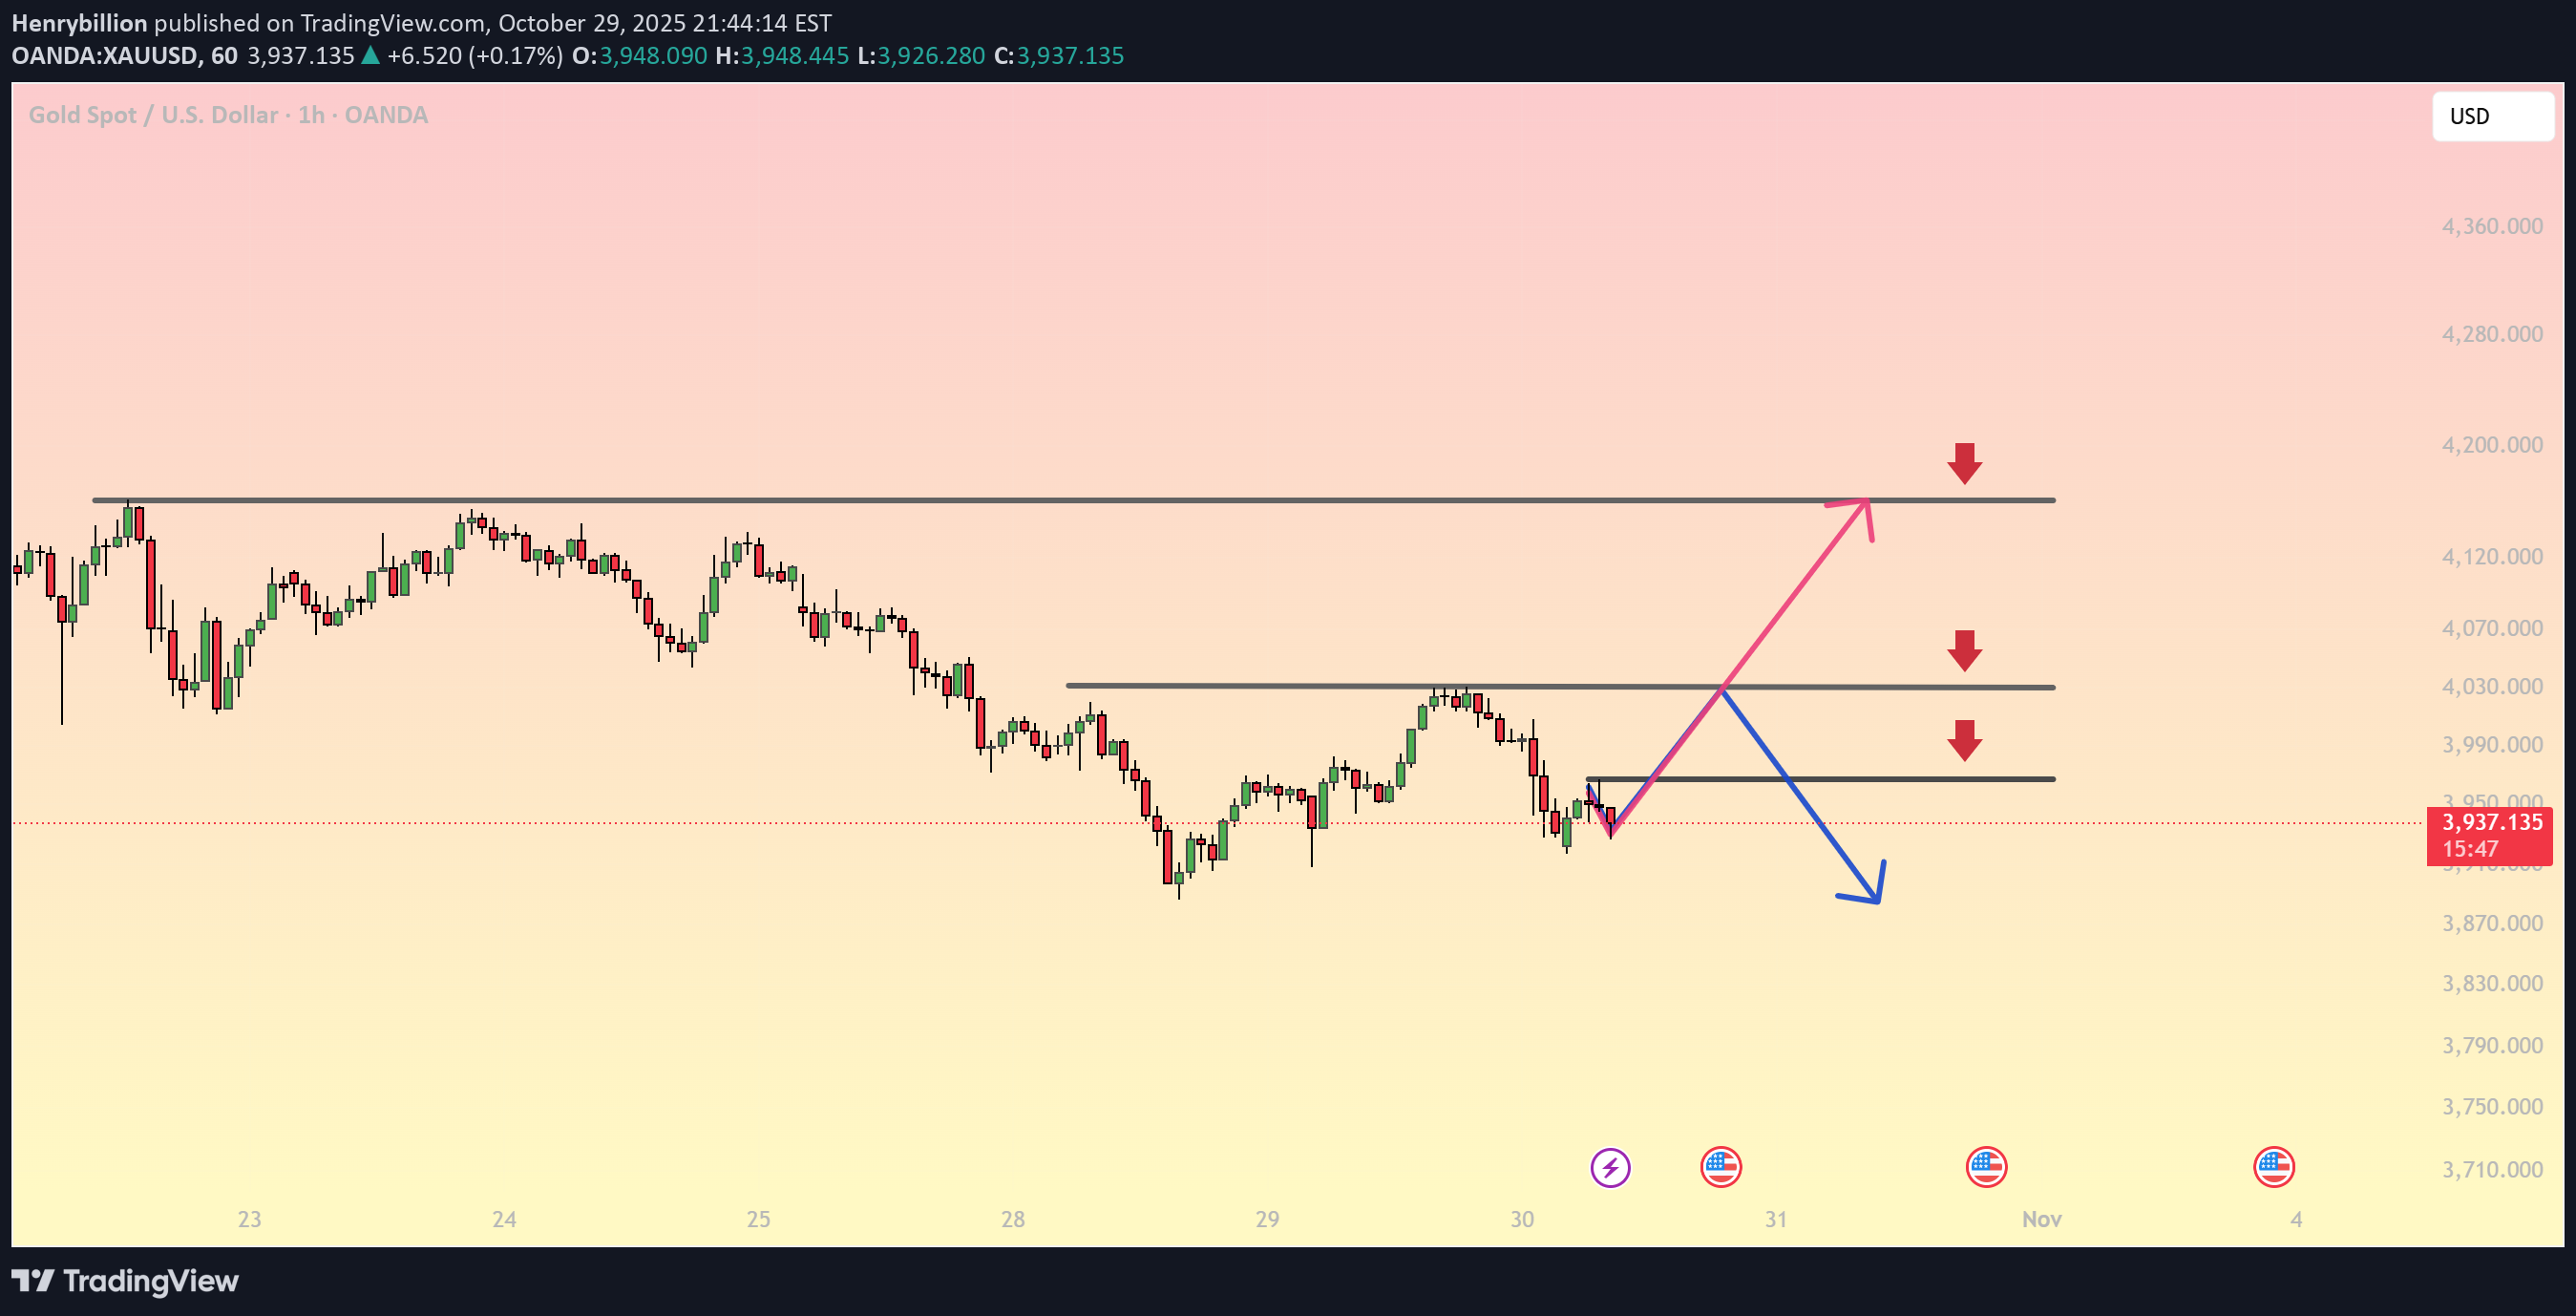
After moving into the new day, the market’s behavior remains within expectations, showing no significant change in the overall structure. On the H1 chart, gold continues to fluctuate around $3,940, facing a clear short-term resistance near $3,990–$4,000 and a higher resistance zone around $4,070–$4,120. From a technical perspective, the price is attempting a short-term pullback. If buyers manage to hold above the intraday support zone of $3,920–$3,910, a corrective rally toward $4,000–$4,070 could unfold. However, failure to sustain above that area could trigger another leg down, targeting $3,870 and possibly $3,820. The RSI remains neutral, showing no strong momentum shift yet, while EMA lines suggest bearish pressure remains dominant until a breakout above $4,070 occurs. This makes the current phase a liquidity-building zone before a decisive move either way. Key Levels to Watch Resistance 1: $3,990–$4,000 Resistance 2: $4,070–$4,120 Support 1: $3,920–$3,910 Support 2: $3,870–$3,820 Trading Strategy Scenario 1 (Bullish): Wait for a confirmed break and retest above $4,000 to aim for $4,070–$4,120. Scenario 2 (Bearish): If price rejects the $4,000–$4,070 zone, consider short positions toward $3,870 with tight risk control. Gold traders should remain patient and let price action confirm direction before committing to new entries. Remember, clarity often comes after liquidity sweep — stay disciplined and react to confirmation, not prediction.