Technical analysis by CryptoSanders9563 about Symbol BTC: Buy recommendation (10/22/2025)

CryptoSanders9563
تحلیل فوری بیت کوین: سطوح حیاتی 2 ساعته برای صعود یا سقوط قیمت BTC!
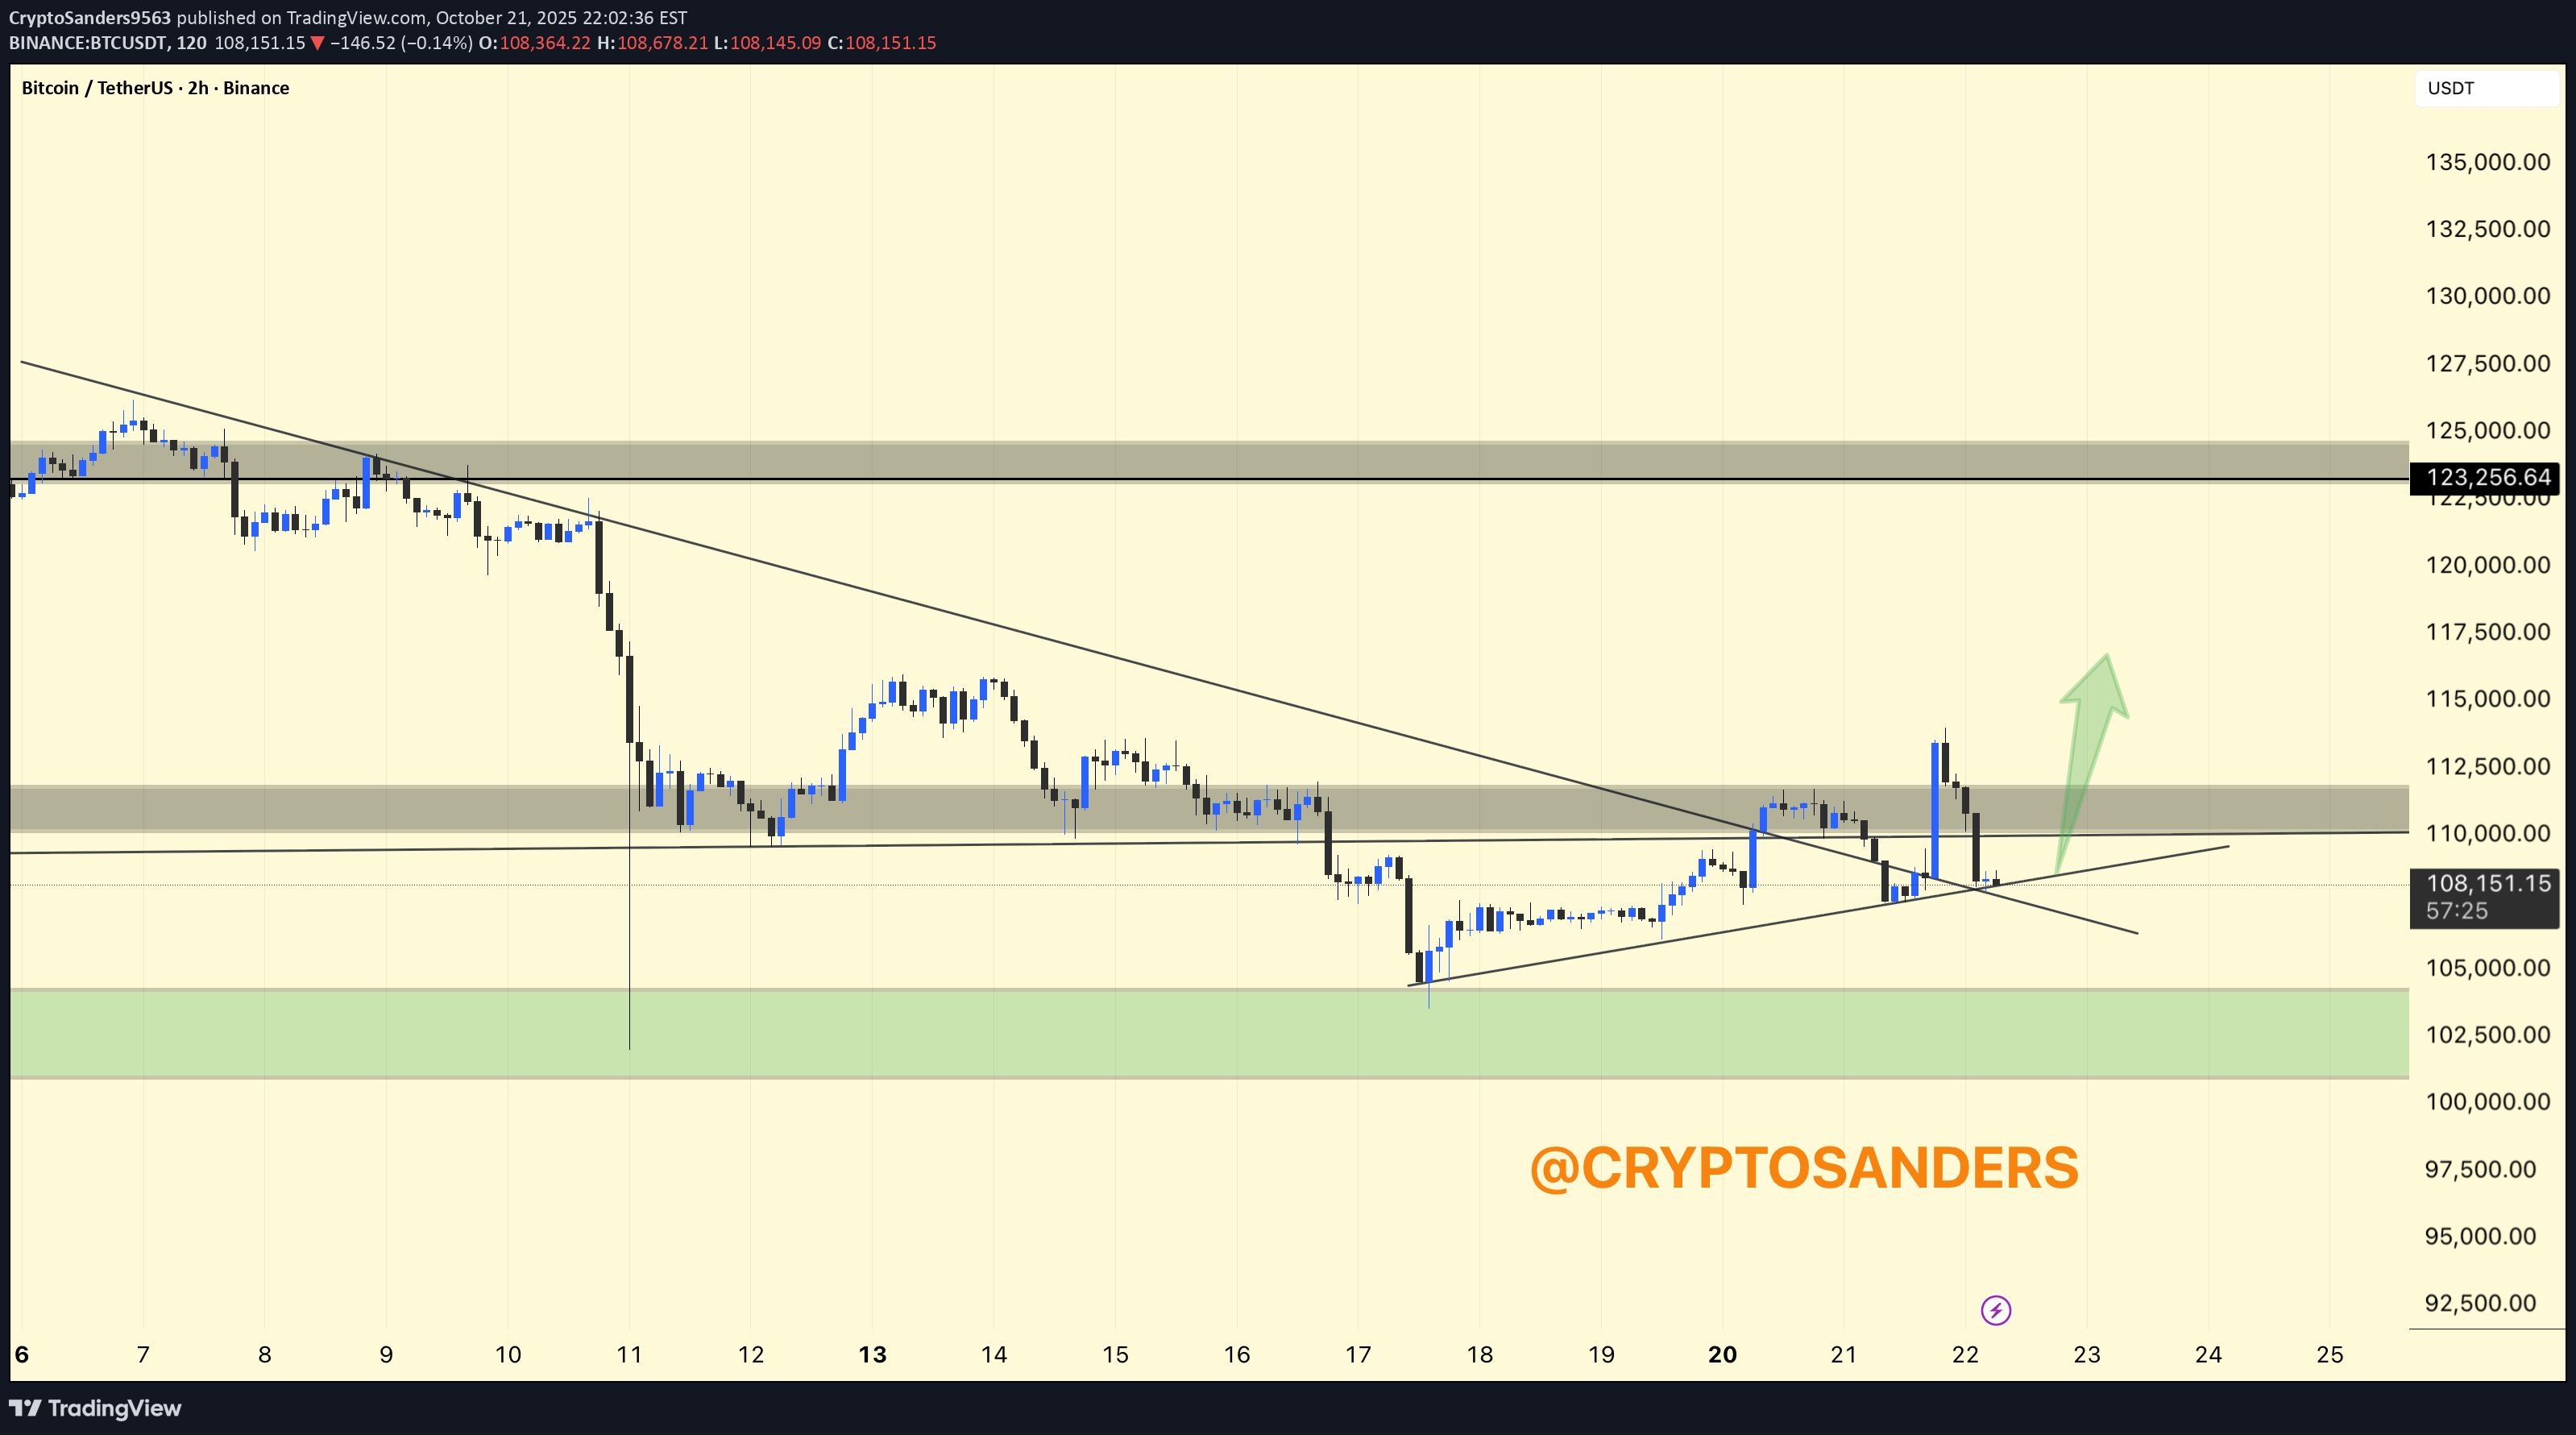
BTCUSDT 2-Hour Chart Analysis This 2-hour chart of Bitcoin/USDT shows the shift in price structure, as well as key technical levels and potential scenarios: Bitcoin has broken out of a long-standing descending trendline and initially retested this breakout. The market recently reached the resistance area around $111,000-$112,500, marked by the gray band. Support: The previous green box ($102,500-$106,000) remains a key demand area below, where buyers previously emerged. Resistance: The gray resistance area of $111,000-$112,500 has caused several rejections, but now the price is consolidating just below it after a breakout attempt. Higher resistance at $123,000-$124,000 remains a distant target. Retest and Breakout: After reclaiming the trendline, the price has returned to test support at the breakout level and the lower trendline. This retest is significant: if bulls defend this area, we could see a new uptrend toward the $112,500 resistance area and possibly even higher, as indicated by the green arrow. Upside Scenario: If the price remains above the intersection of the trendline and horizontal support, a rally toward $115,000-$117,000 becomes possible. Downside Risk: Failure to hold the breakout level could cause the price to retrace to the green support area below $106,000. DYOR | NFA