Technical analysis by MALBERT3468 about Symbol BTC: Buy recommendation (7/28/2025)

MALBERT3468
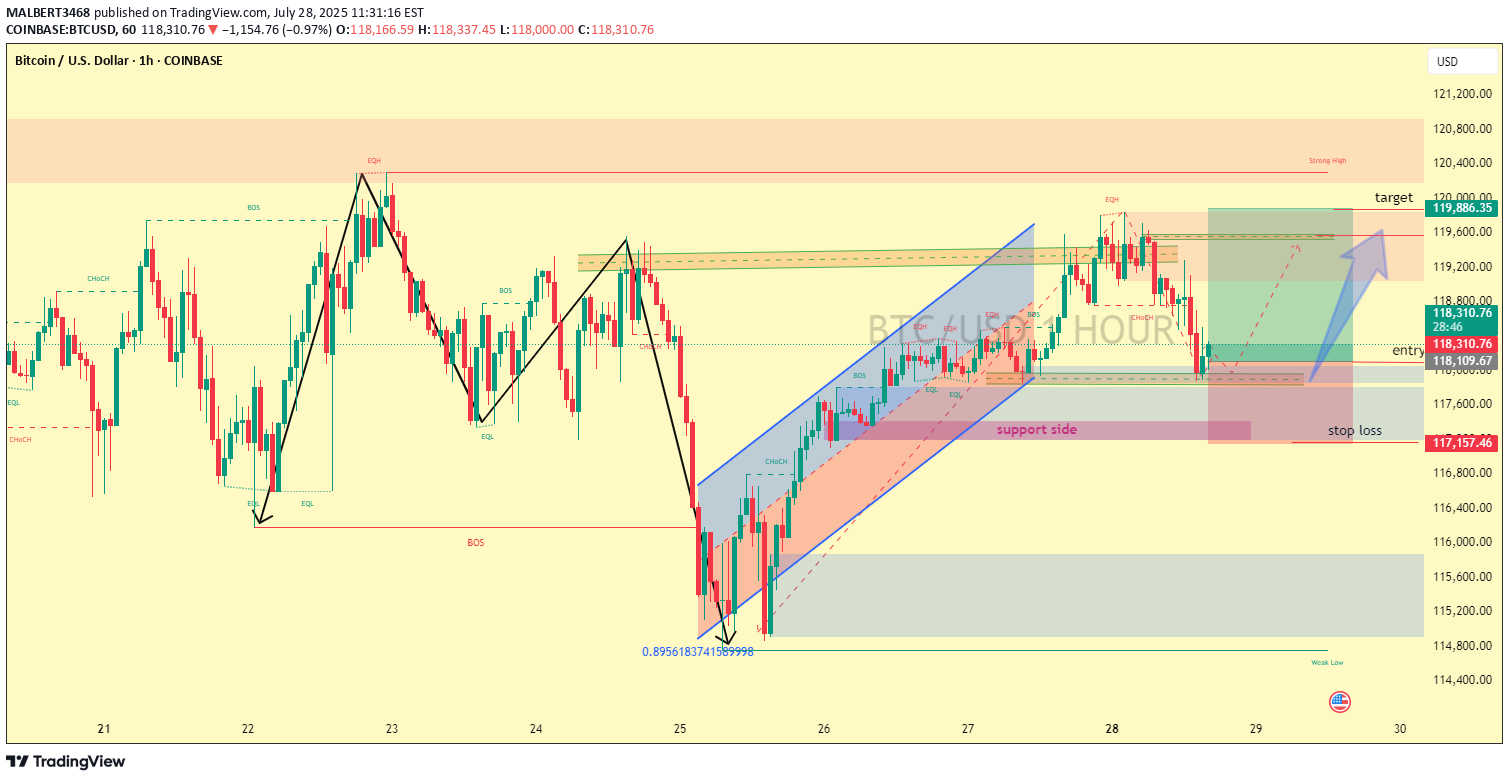
Perfect — let’s break down your BTC/USD (Bitcoin vs US Dollar) 1H chart in detail. Chart Analysis 1. Market Context The price action shows strong bullish recovery after a breakdown, with Bitcoin moving inside an ascending channel (highlighted in blue). The channel support side has been tested recently, and buyers defended it. 2. Key Levels Entry Zone: Around 118,300 – 118,400 (where price currently sits). Stop Loss: Below 117,150 (red zone). Target: Around 119,800 – 120,000 (highlighted in green with resistance). --- 3. Price Structure Multiple Break of Structure (BOS) labels show shifts in momentum. The last BOS was bullish, supporting the idea of continuation to the upside. There’s also a liquidity grab below minor equal lows (EQL), followed by a recovery — a common bullish sign. --- 4. Setup Idea Trade Bias: Bullish (Buy Setup) Logic: Price tapped the support side of the channel. Rejection from demand zone (purple) showshalf of the target is achieved successfully hit 110+ pipsSorry guys for late update, now market goes in our favour but dont target hit . around 115+PIPS in profit. then STOP LOSS hit . sorry for this ready for next target.
