Technical analysis by Mr_Zakrii about Symbol PAXG: Buy recommendation (7/17/2025)

Mr_Zakrii
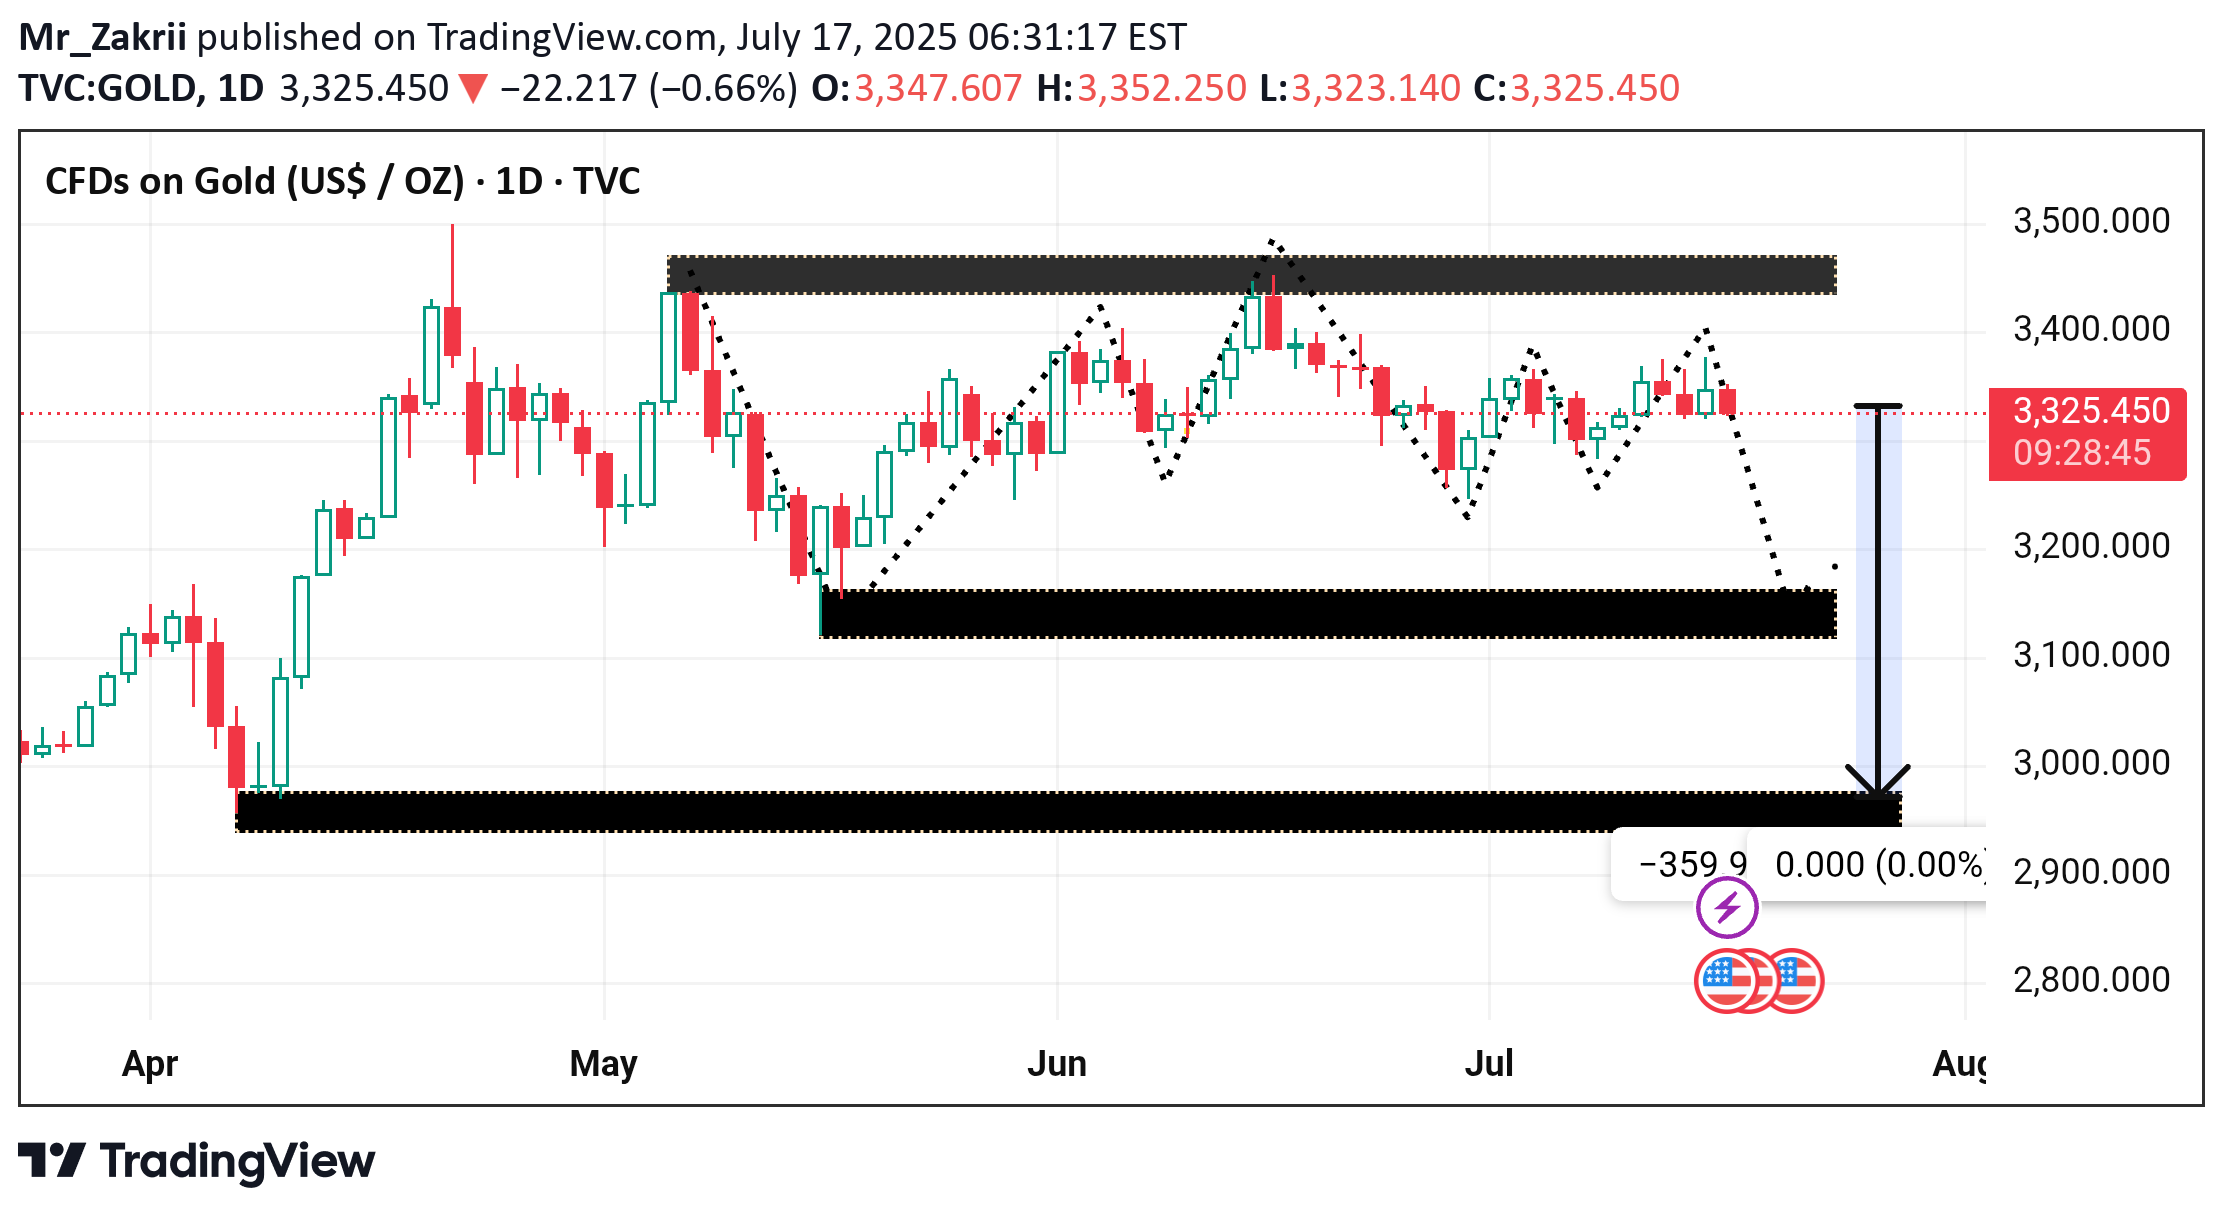
This third chart shows a daily (1D) timeframe analysis of Gold CFDs (XAU/USD), with a clear distribution range and a bearish breakdown scenario. --- Key Elements on the Chart 🔸 Current Price 3,325.900, down -21.767 (-0.65%) --- Major Levels 1. Resistance Zone (~3,385–3,410) Price has failed multiple times here (distribution phase). Acts as a strong ceiling. 2. Mid-Level Support (~3,200–3,225) Multiple rejections from this zone in May and June. Critical pivot area — price may bounce or break through. 3. Major Support Zone (~2,950–2,975) If the 3,200 level breaks decisively, this is the next bearish target. Chart projects a ~350-point drop, equivalent to a ~10.5% move. --- Bearish Breakdown Scenario Dashed black line and downward arrow signal a potential breakdown. Measured move arrow targets the 2,950 zone, based on range height projection. Upcoming U.S. economic events are highlighted — likely FOMC or inflation data that could trigger volatility. --- Summary The chart strongly suggests that gold is in a distribution phase, consolidating below key resistance. A daily close below ~3,200 would confirm a bearish breakdown, with a projected target near 2,950. On the flip side, holding above 3,200 may keep price in range-bound consolidation. --- Let me know if you want a multi-timeframe strategy based on these 3 charts — with clear entries, SLs, and TPs.
