Technical analysis by Mr_Zakrii about Symbol PAXG on 7/17/2025

Mr_Zakrii
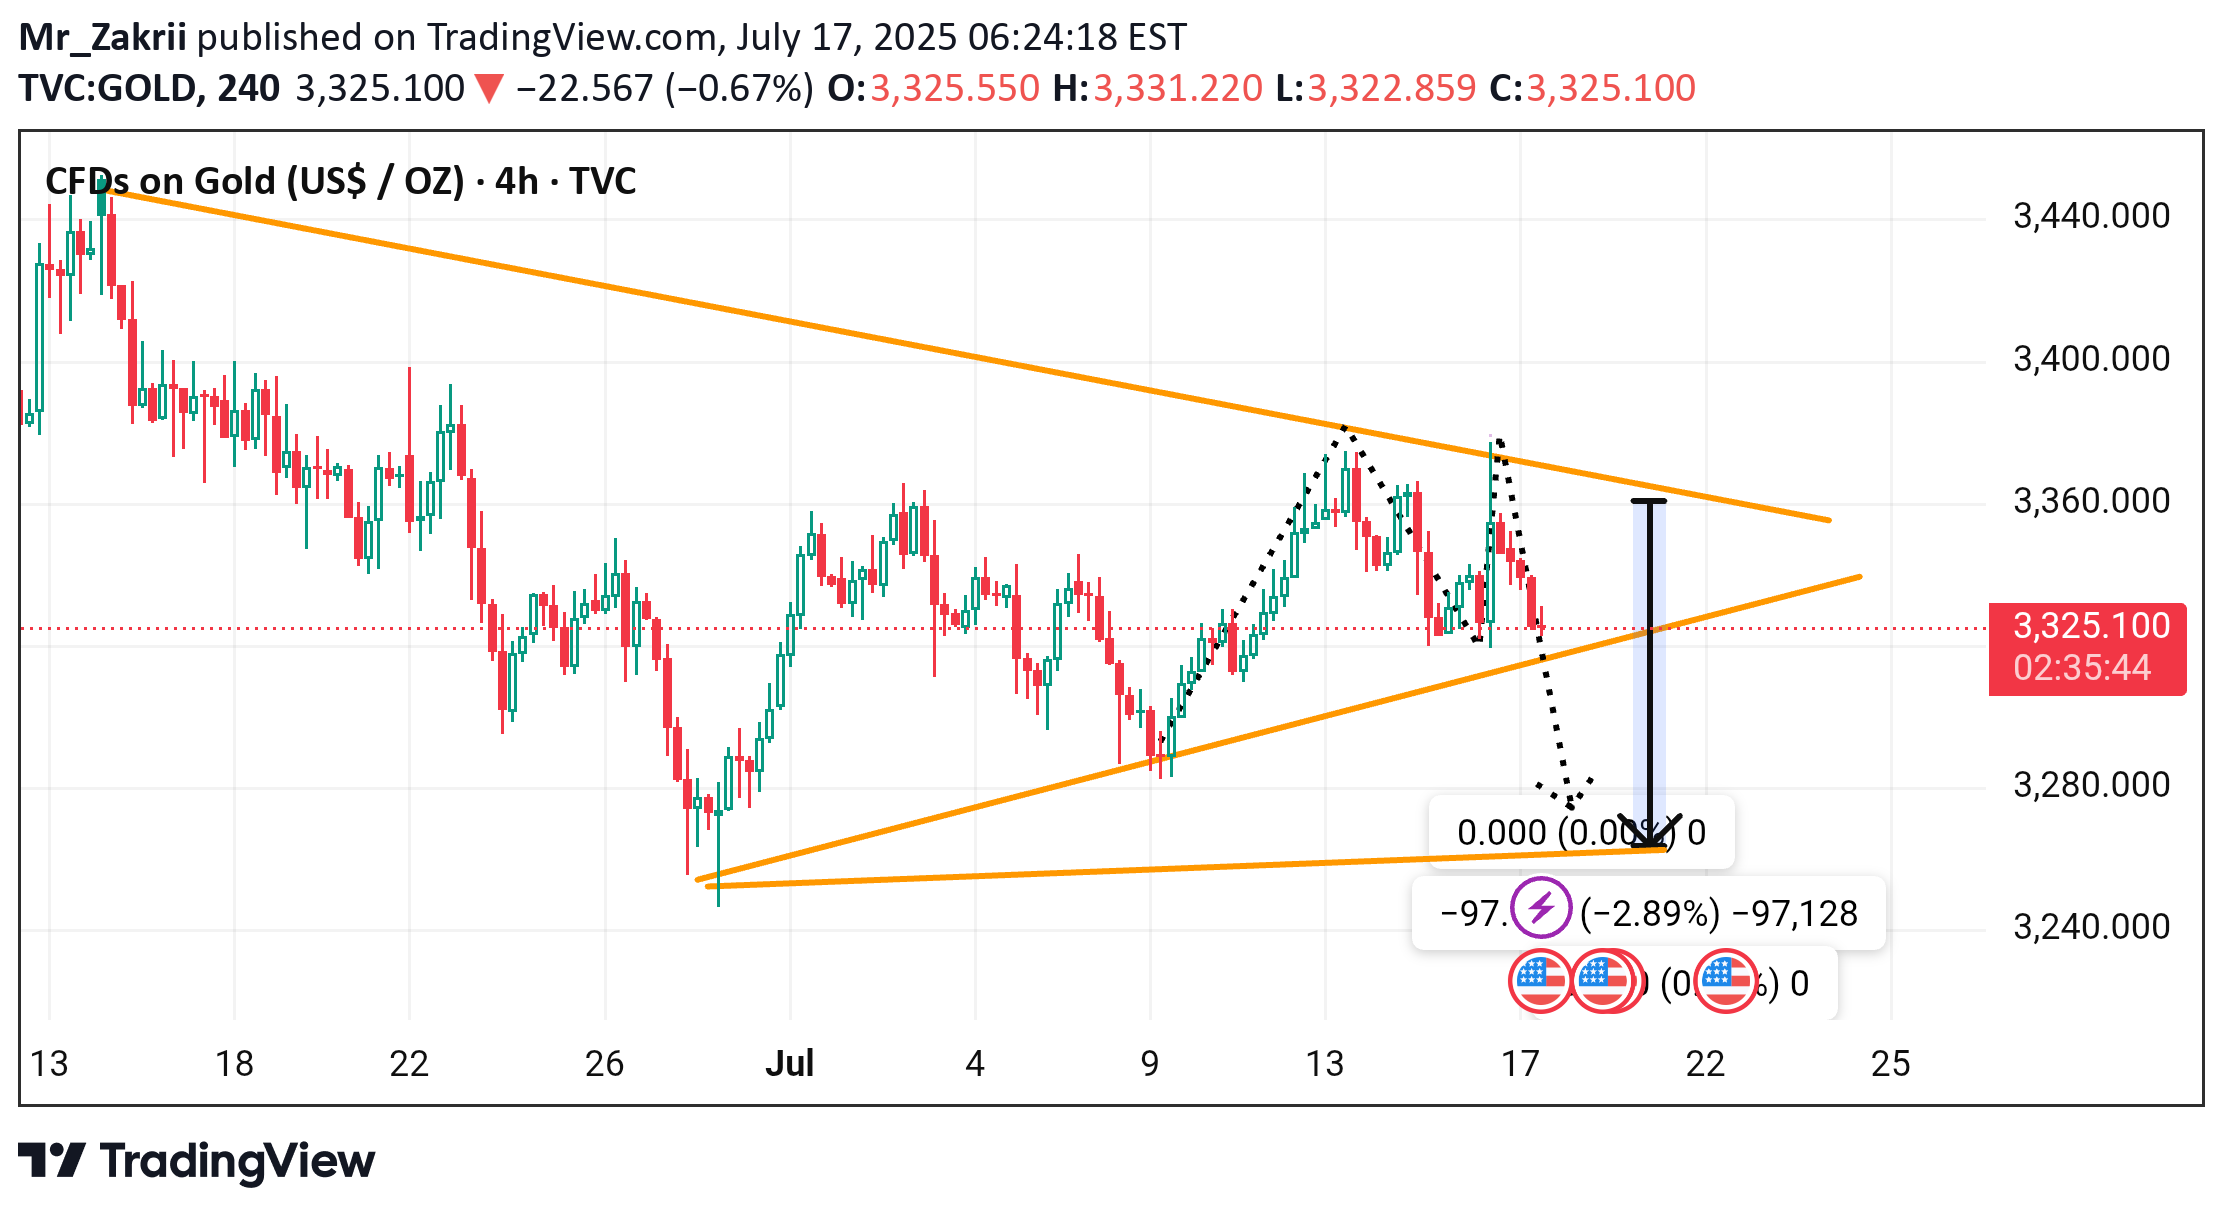
This second chart shows a 4-hour timeframe analysis of Gold CFDs (XAU/USD), focusing on a potential symmetrical triangle pattern and an expected breakout move. --- Key Observations 🔸 Chart Pattern: Symmetrical Triangle Formed by converging lower highs and higher lows. Indicates price compression — a breakout is likely soon. Price is currently near the apex of the triangle. --- Current Price 3,326.990, down -20.677 (-0.62%) --- Bearish Breakout Bias The chart highlights a potential downward breakout. Arrow shows a projected drop of ~97 points from triangle support. This move targets the 3,230 area, suggesting a ~2.89% decline from the breakout point. --- Dotted Arrows & Markers Dotted lines show the breakdown steps. U.S. flag icons likely indicate upcoming economic events (possibly high-impact ones like Fed announcements or CPI). --- Conclusion & Strategy Implications Triangle nearing breakout point: Expect volatility soon. Bearish scenario favored, targeting ~3,230. If price reclaims upper trendline (~3,350+), the bearish setup invalidates and a bullish breakout may follow instead. --- Would you like a detailed trading plan (entry, SL, TP) based on either breakout direction?
