Technical analysis by Mr_Zakrii about Symbol PAXG: Sell recommendation (7/17/2025)

Mr_Zakrii
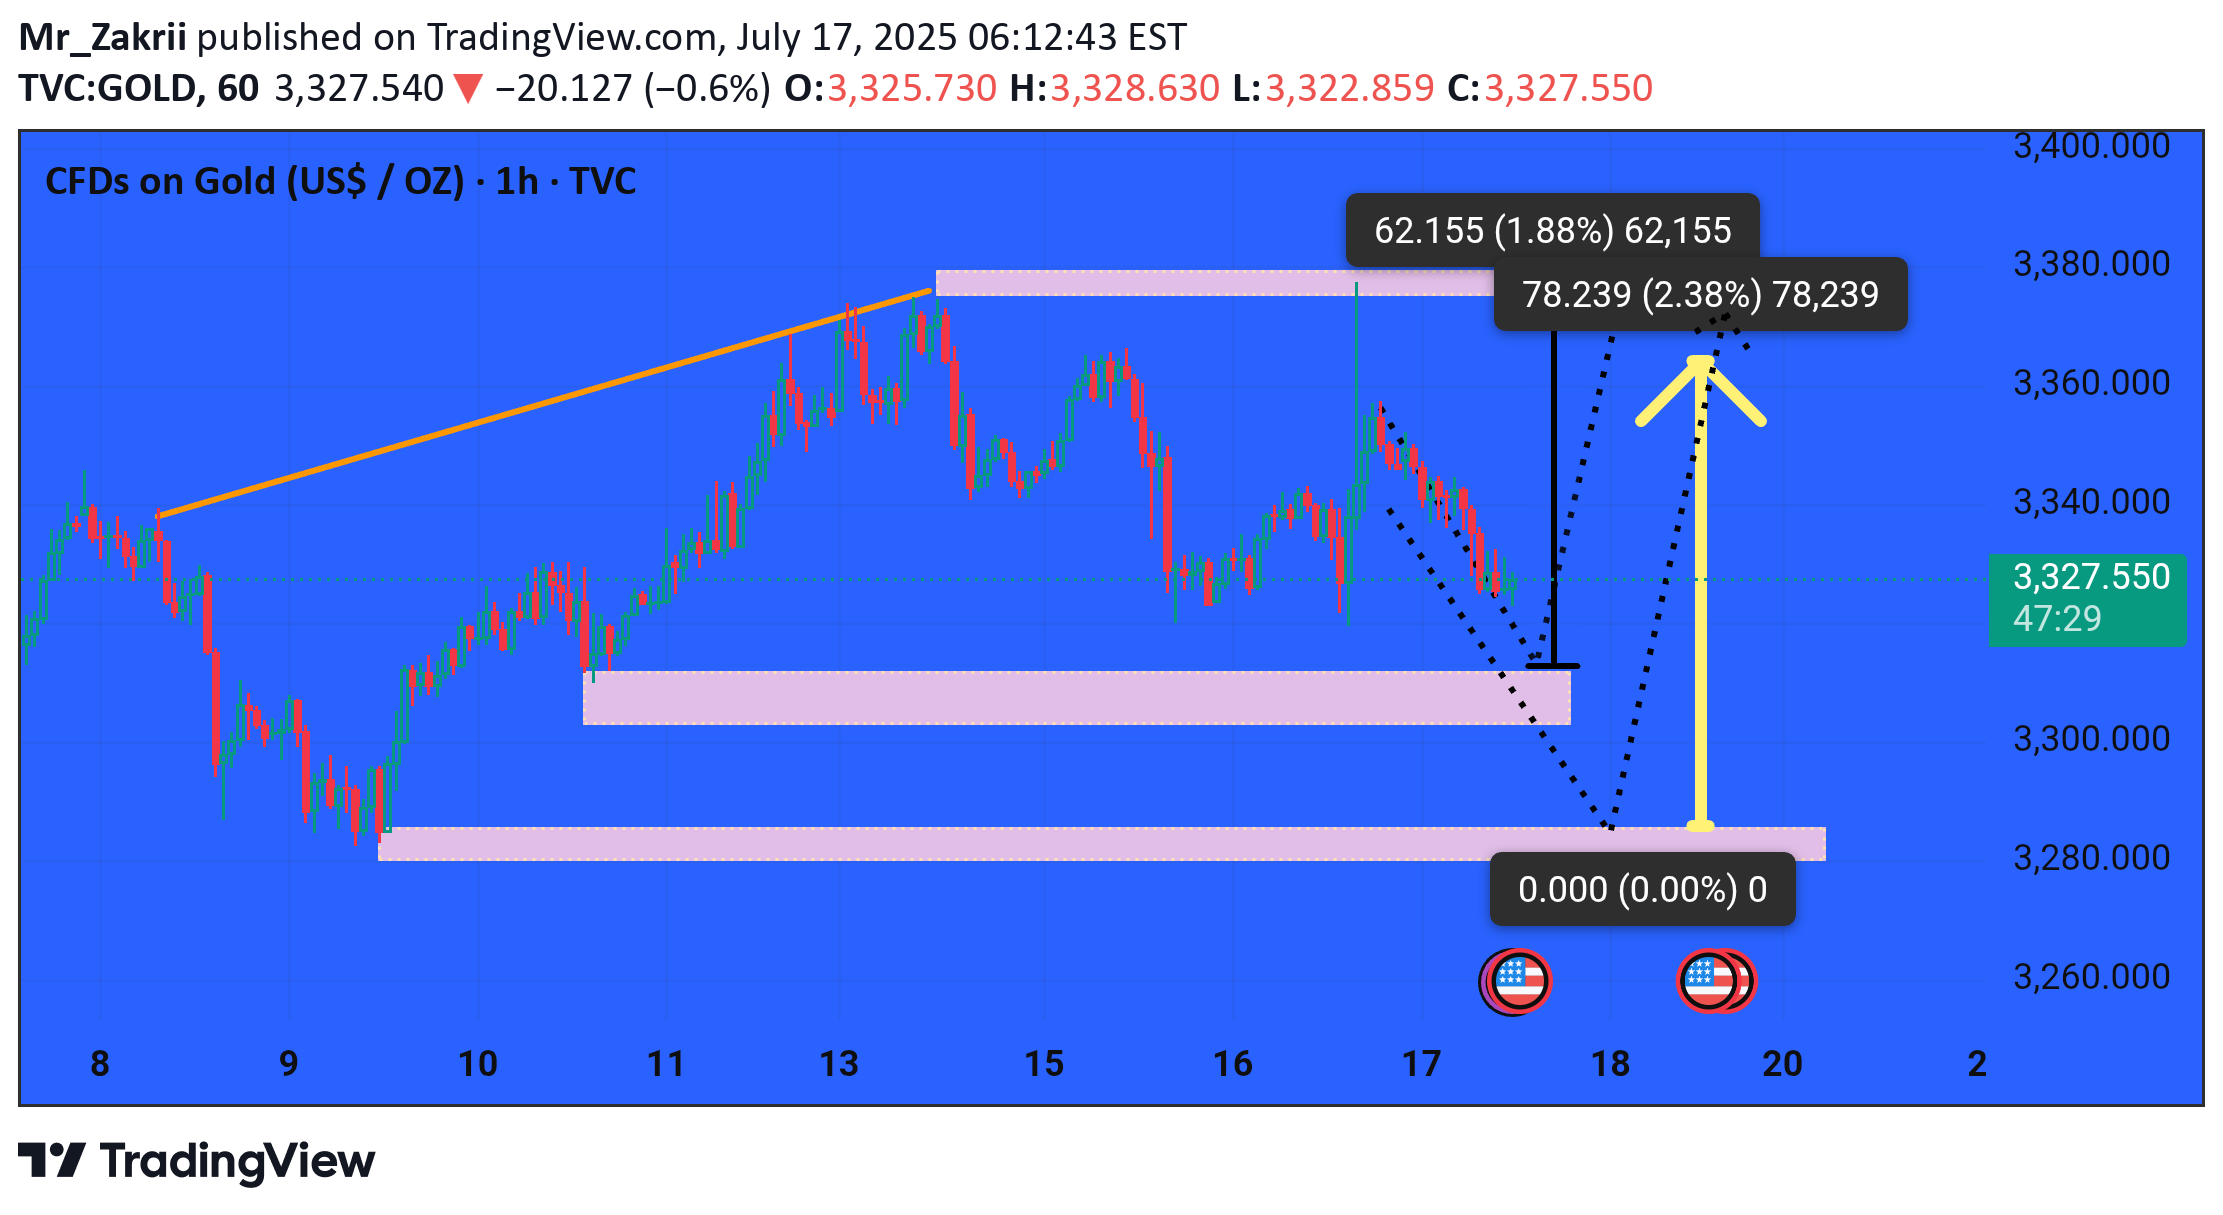
This chart shows a 1-hour timeframe analysis of Gold CFDs (XAU/USD) with key price levels and potential scenarios illustrated: Current Price 3,326.820, down -20.687 (-0.62%) --- Highlighted Zones 1. Upper Supply Zone (~3,380 - 3,390) Previously tested resistance area. Price reacted strongly here and dropped. 2. Middle Demand Zone (~3,305 - 3,315) Minor support zone; price is currently hovering near this level. Potential for a short-term bounce. 3. Lower Demand Zone (~3,270 - 3,285) Strong support area. May act as a bullish reversal zone if price drops further. --- Chart Patterns and Forecast Scenarios Dotted Arrows indicate two scenarios: 1. Bearish scenario: Price falls to the lower demand zone (~3,275), then rebounds. 2. Bullish bounce: Price rebounds from the current or lower zone back to the supply zone (~3,380+). Measured Moves: Possible bounce of 84.443 points (2.57%) back to the supply zone. A shorter move (~62 points) could happen from the middle zone as well. Horizontal Lines: Represent projected targets based on these measured moves. --- Conclusion This chart suggests a bullish setup may occur if: Price finds support at 3,305 or 3,275 levels. A breakout back above 3,350–3,380 would confirm bullish momentum. But if the lower support breaks, more downside risk opens. Let me know if you want a trade setup or risk-reward plan based on this.
