Technical analysis by Mr_Zakrii about Symbol BTC on 7/14/2025

Mr_Zakrii
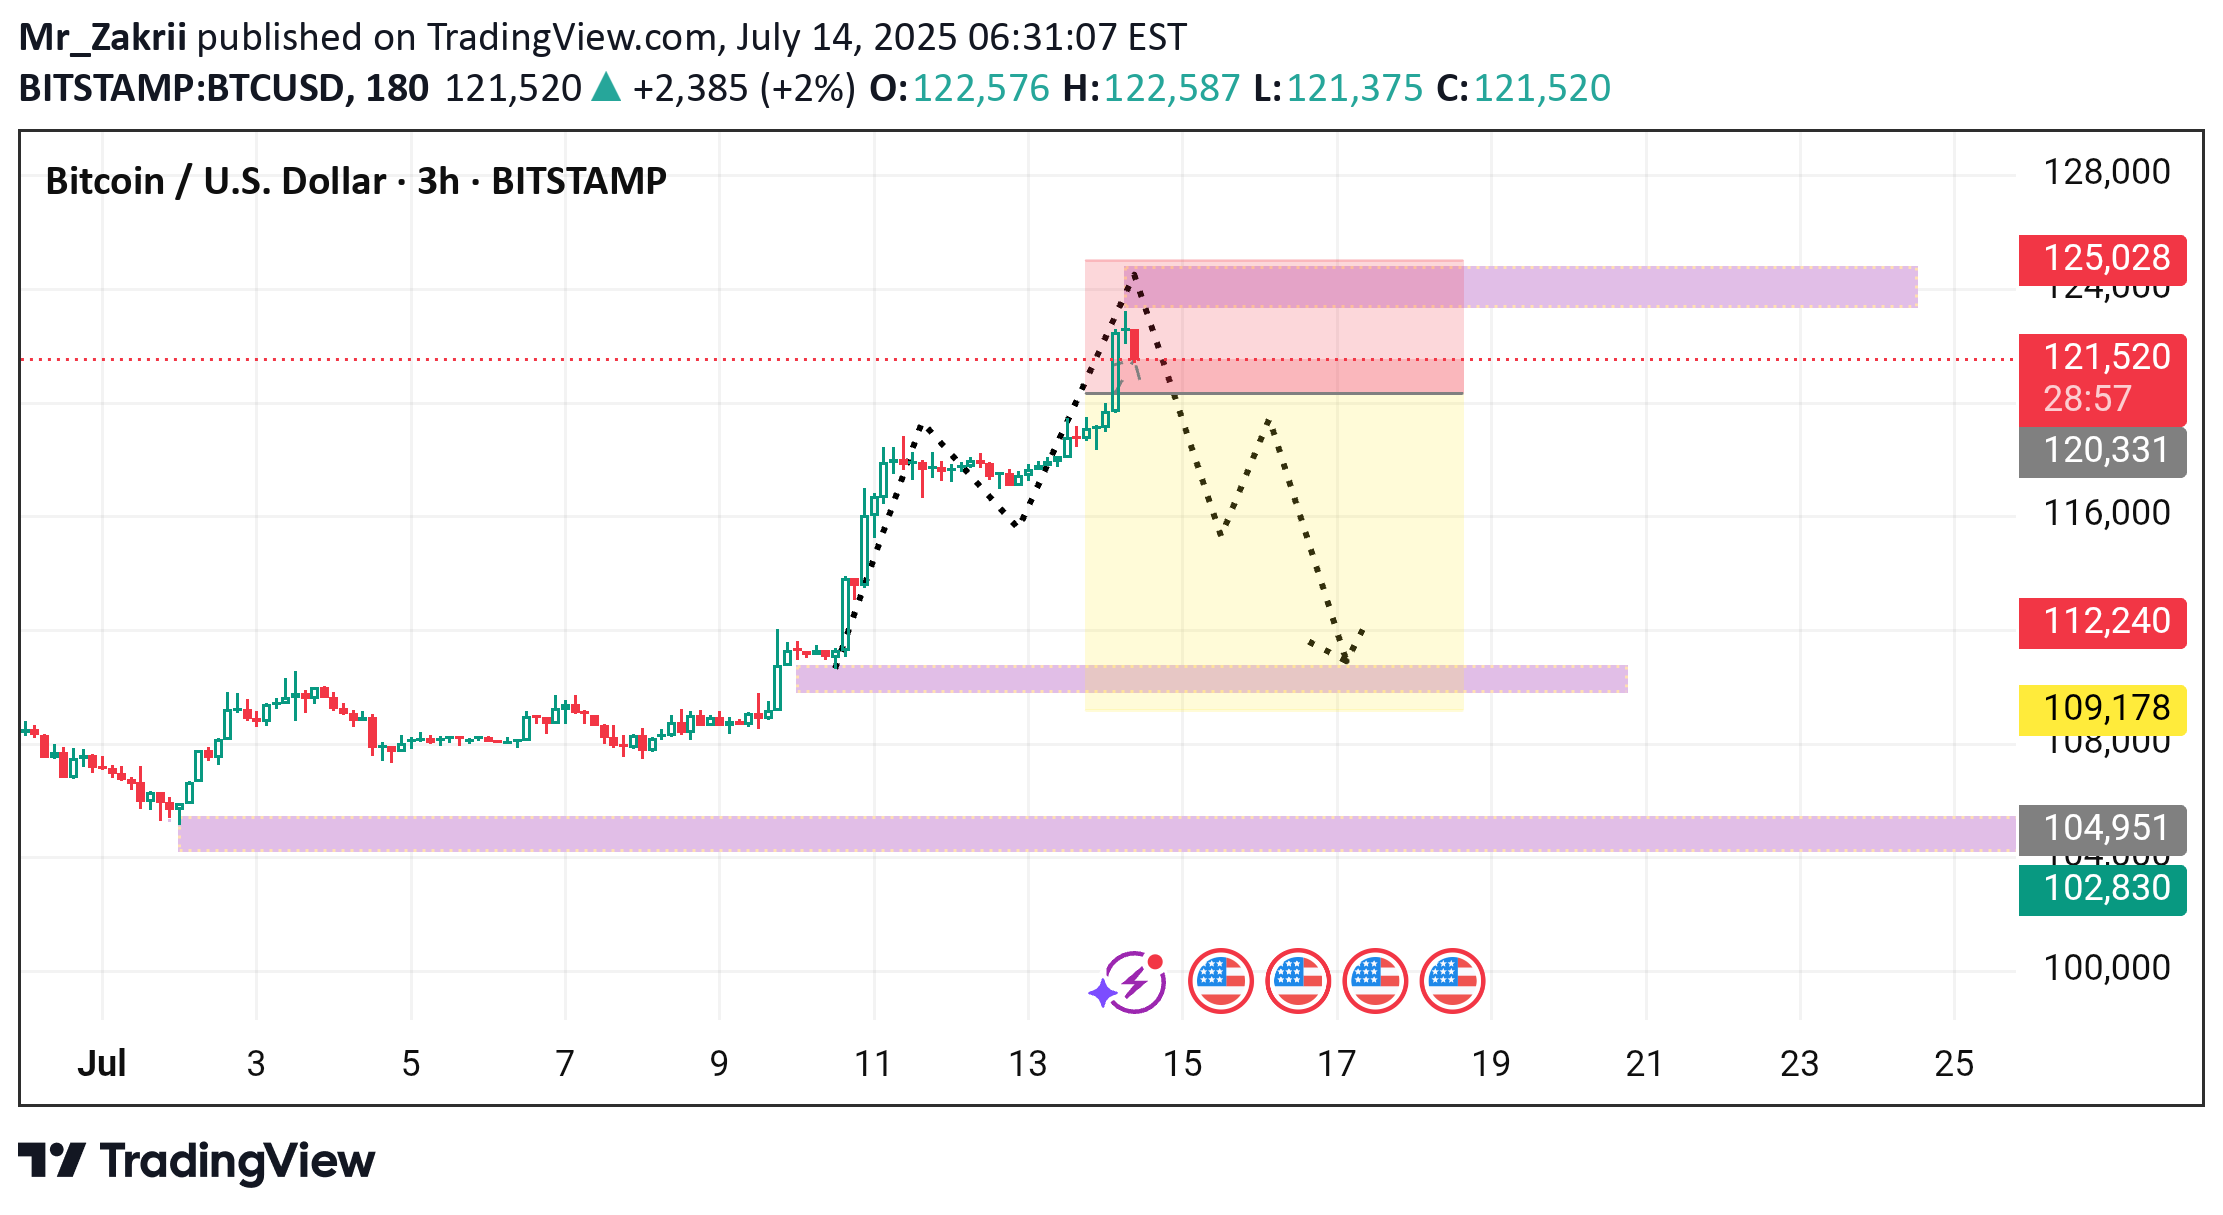
This is a 3-hour BTC/USD (Bitcoin vs. US Dollar) chart showing a bearish short-term projection after a recent bullish run. Here's a detailed breakdown: --- 📈 Current Price: $121,482 (+1.97%) --- 🔍 Chart Highlights: ✅ Bullish Rally (before July 14): Strong upward momentum with consolidation followed by breakout. Recent high near $125,000 marks the local top. 📉 Bearish Reversal Zone (Red Box): Price sharply rejected near $125,000. Currently hovering around the red resistance zone, showing potential distribution. --- 🟡 Forecast (Dotted Black Path): Suggests a drop from current levels toward: First support at ~$112,240 (red zone). Possibly lower, into the yellow range (~$109,178). Indicates a bearish correction within the highlighted yellow zone, despite previous strength. --- 📊 Key Levels: LevelTypeComment 125,028ResistanceLocal top & rejection area 121,482CurrentPrice at time of capture 120,331Minor SupportNear-term reaction point 112,240SupportFirst major downside target 109,178SupportKey structural level 104,951–102,830Strong SupportLong-term demand zone --- 📅 Events & Volatility Triggers: Cluster of U.S. economic events (Jul 15–17) shown at the bottom — likely to increase volatility, particularly around inflation or Fed-related data. --- 🧠 Conclusion: This chart signals a bearish short-term correction for Bitcoin: Target zone: $112,000–$109,000 Catalysts: Overbought rejection + incoming macro data If support around $109K breaks, next major demand zone is near $103K. Would you like a possible trading strategy (e.g., short entry, stop-loss, target)?
