Technical analysis by Nabi_Gunduz about Symbol PAXG on 7/13/2025

Nabi_Gunduz
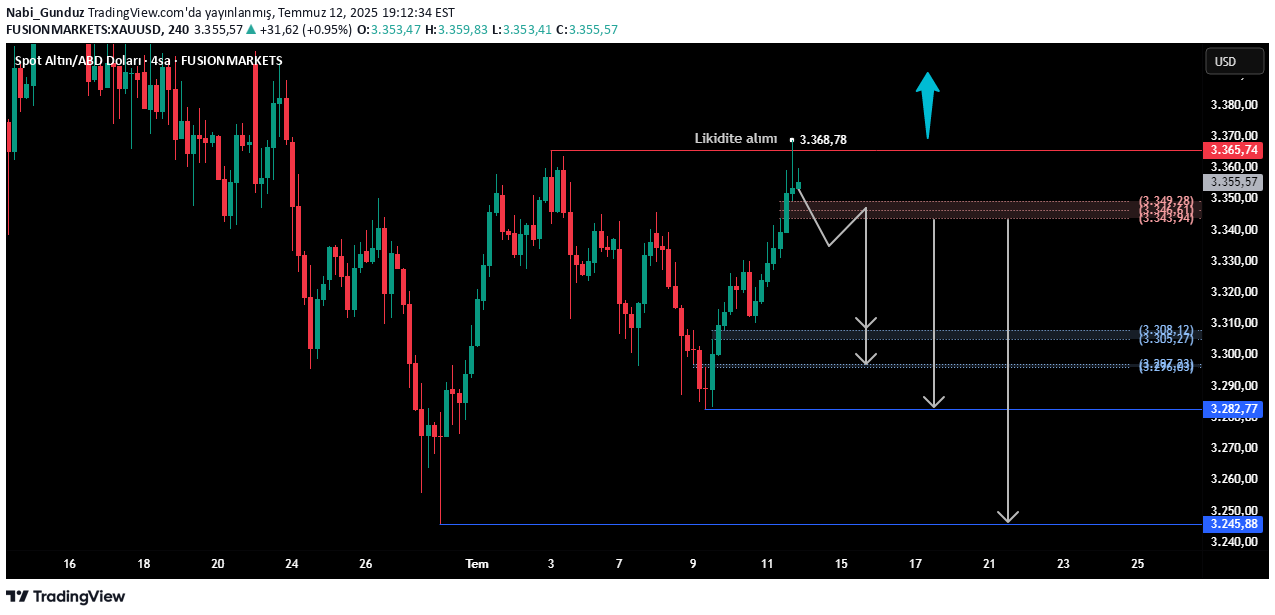
It was a level of liquidity 3365.74 in a 4 -hour period. The wax, which saw the level of 3368.78, passed the level of liquidity upward, but it was closed below this level and the possibility of a liquidity operation was likely to be a liquidity. The region between the bottom level of the candle that took the liquidity and the peak level of the wax two before it has formed a FVG region. The graph will be transformed into the region of IFVG (Inverse Fair Value GAP) with a 4 -hour candle closure under this region, which is seen with a pink color, and when the price visits this area again, the region will be likely to decrease by showing a resistance. In such a case, it is a technical method to get a stoploss loyra on 3368.78. Of course, to make it more guaranteed, it is the most logical thing to get help from different formations in price movements by shrinking time zones. For example, if we examine the graph in a 1 -hour period; We see that there is a 1-hour candle closure under a FVG region in the range of 3354.24-3357.03 and the price tested the area that has turned into IFVG. The price of the price again will give us a sign of a decrease. If there is 1 hour closing over 3357.03, we will need to follow other formations while waiting for the 4 -hour breakdown, as this area will be canceled. Again, if we examine the same graph in a 30 -minute time period; We see that the turn from the hill is a decrease in the engulfing candle structure. For us, this will be a phenomenon that we can consider as a positive sign for a decrease when the conditions in the 4 -hour period occur. On the other hand, the region seen with blue in the graph is an IFVG region and the region is tested. If a movement is experienced as I mentioned with the yellow zigzag, this will be a sign that supports the decline, as a market breakdown will be realized in a 30 -minute time period. In fact, after the grocery breakage, the 4 -hour conditions can be opened without waiting for the occurrence of a short -way operation. When we look at the same graph in a 15 -minute time period; A decrease from the hill was formed with a blue at the beginning of the decline that started with the Engulfing candle structure, and the price tested this area and the price was re -decreased during this test and turned its direction down with Engulfing. Only relying on them, taking risks, there may be those who enter the top. Their thought is that when the process is stop, the process will be reduced because it is opened from above. Conservative traders like me, in such cases, at least expect the grocery break ... The choice is up to the investor. If the strategy becomes activated, the possible targets are indicated by gray arrows in graik. The 4 -hour candle closure that may be over 3368.78 before the conditions occurred will show that this movement does not have a liquidity movement and the price may continue to rise ... This strategy is not yet active. Therefore, I recommend you to examine my analysis of the Flag Formation of the Flag Formation I mentioned in my previous sharing during the 4 -hour period. Good holidays ...
