Technical analysis by Mr_Zakrii about Symbol PAXG: Buy recommendation (7/8/2025)

Mr_Zakrii
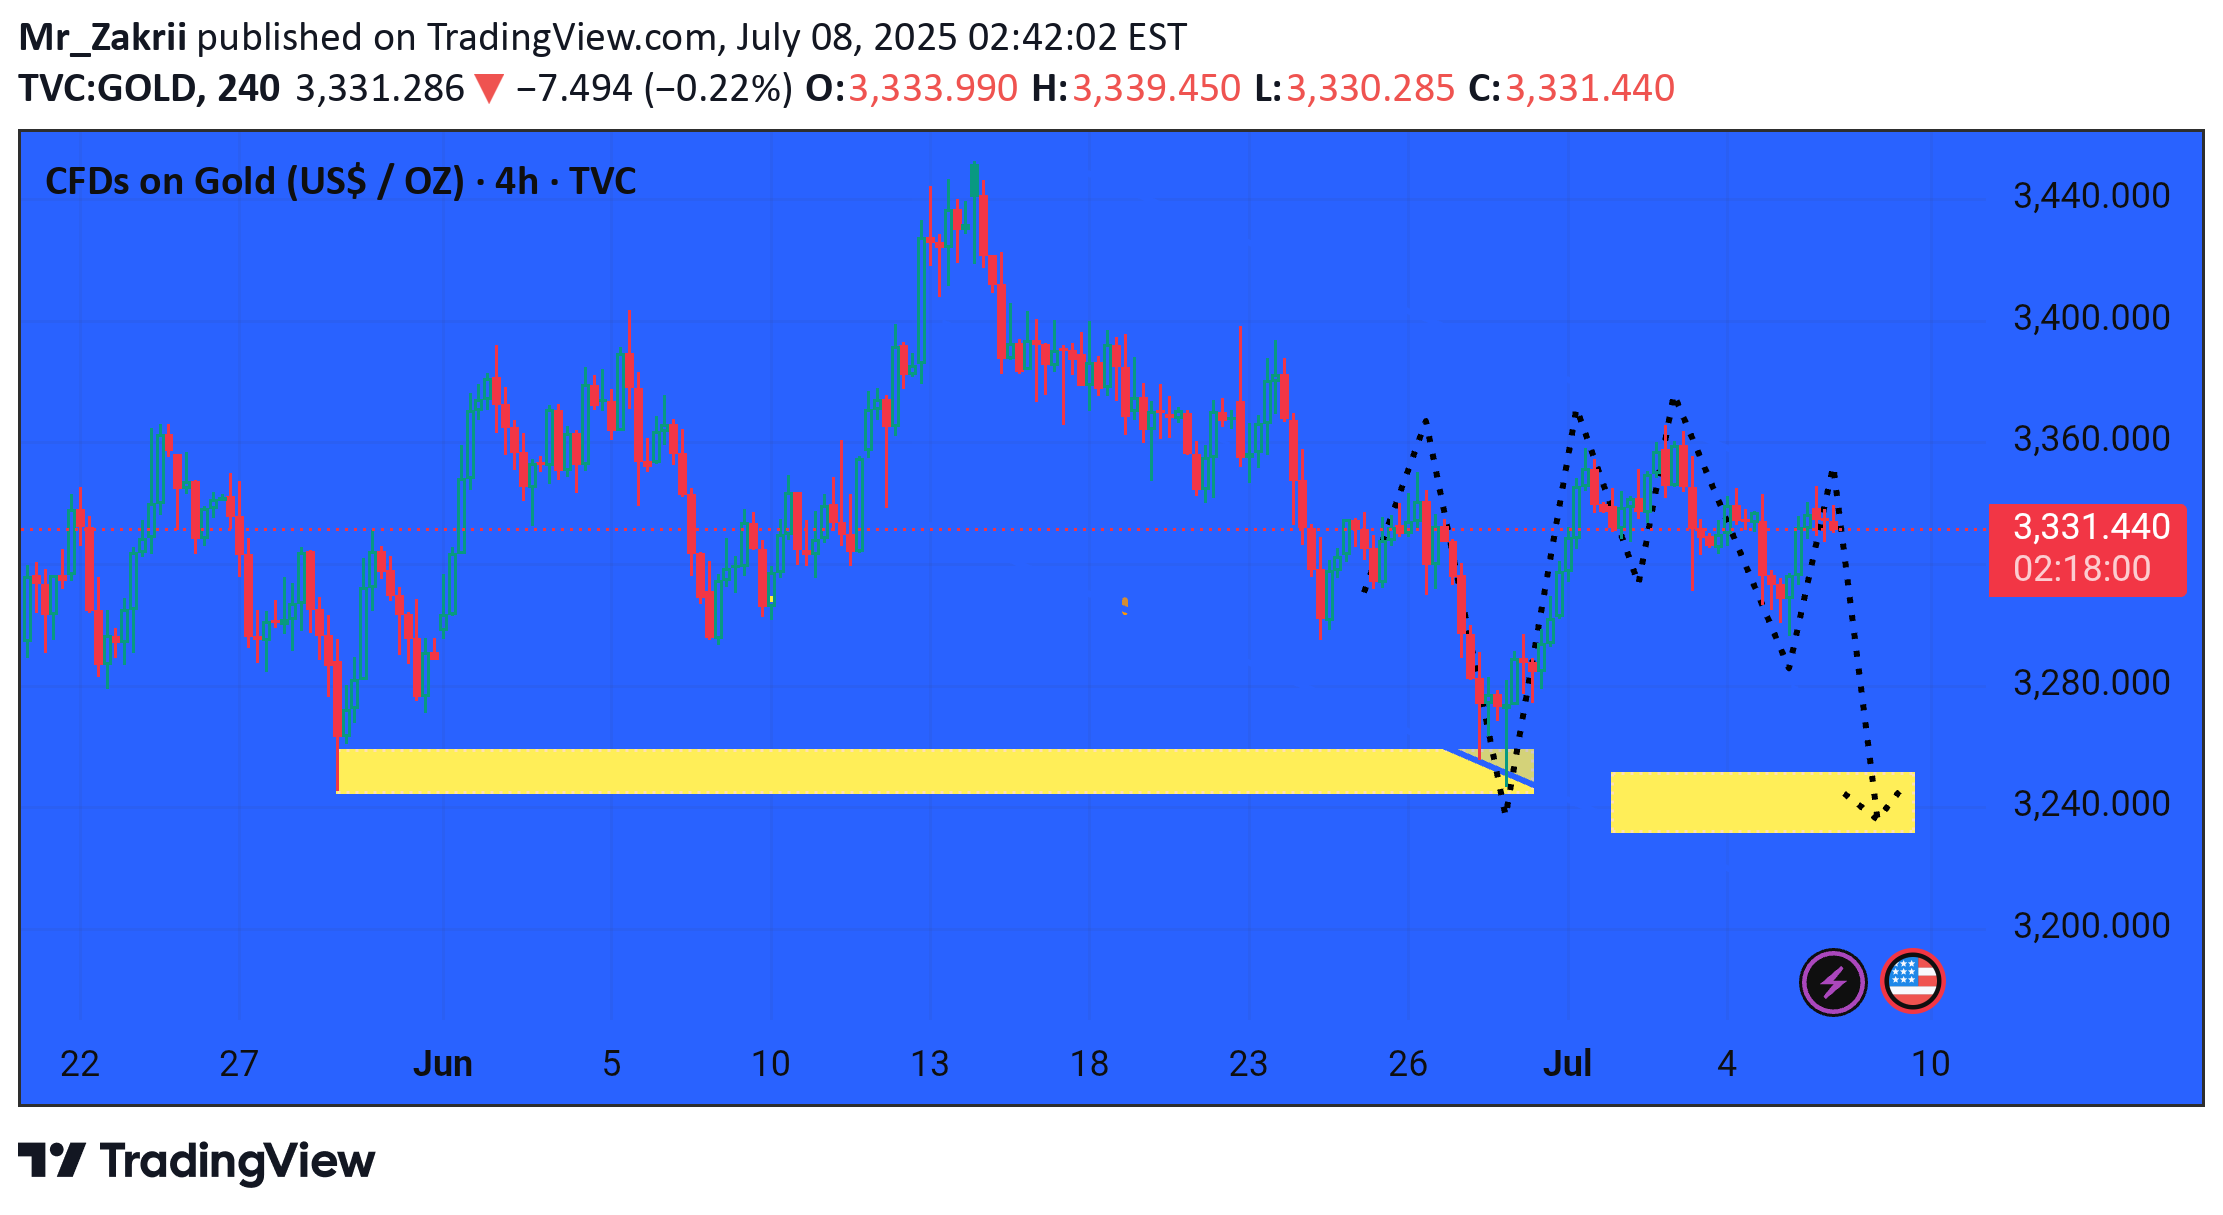
This 4-hour chart of Gold CFDs (XAU/USD) shows a bearish setup forming, with key price action and technical zones highlighted:🔍 Analysis Highlights:1. Current Price: $3,330.51Down -8.17 (-0.24%) at the time of capture.2. Bearish Pattern:The dotted black lines show lower highs and lower lows, indicating a short-term downtrend.A projected bearish leg is drawn, suggesting a further drop.3. Support Zones (Yellow Boxes):First zone around $3,240–$3,265: Recently tested and held.Second zone (future projection) in the same area, implying a possible retest or breakdown.4. Market Context:Price attempted to recover above $3,350 but failed, suggesting weak bullish momentum.A drop toward the highlighted support zone is expected.---🔽 Bearish Outlook:If price fails to hold above $3,330, the next potential move is:Target: $3,250 zone (support)If broken, could slide further toward $3,200.✅ Confirmation for Bears:Break below the yellow box support (~$3,240) with volume.Continuation of lower highs on future candles.Would you like an updated trade idea or stop-loss/take-profit levels based on this?
