Technical analysis by Mr_Zakrii about Symbol PAXG on 7/5/2025

Mr_Zakrii
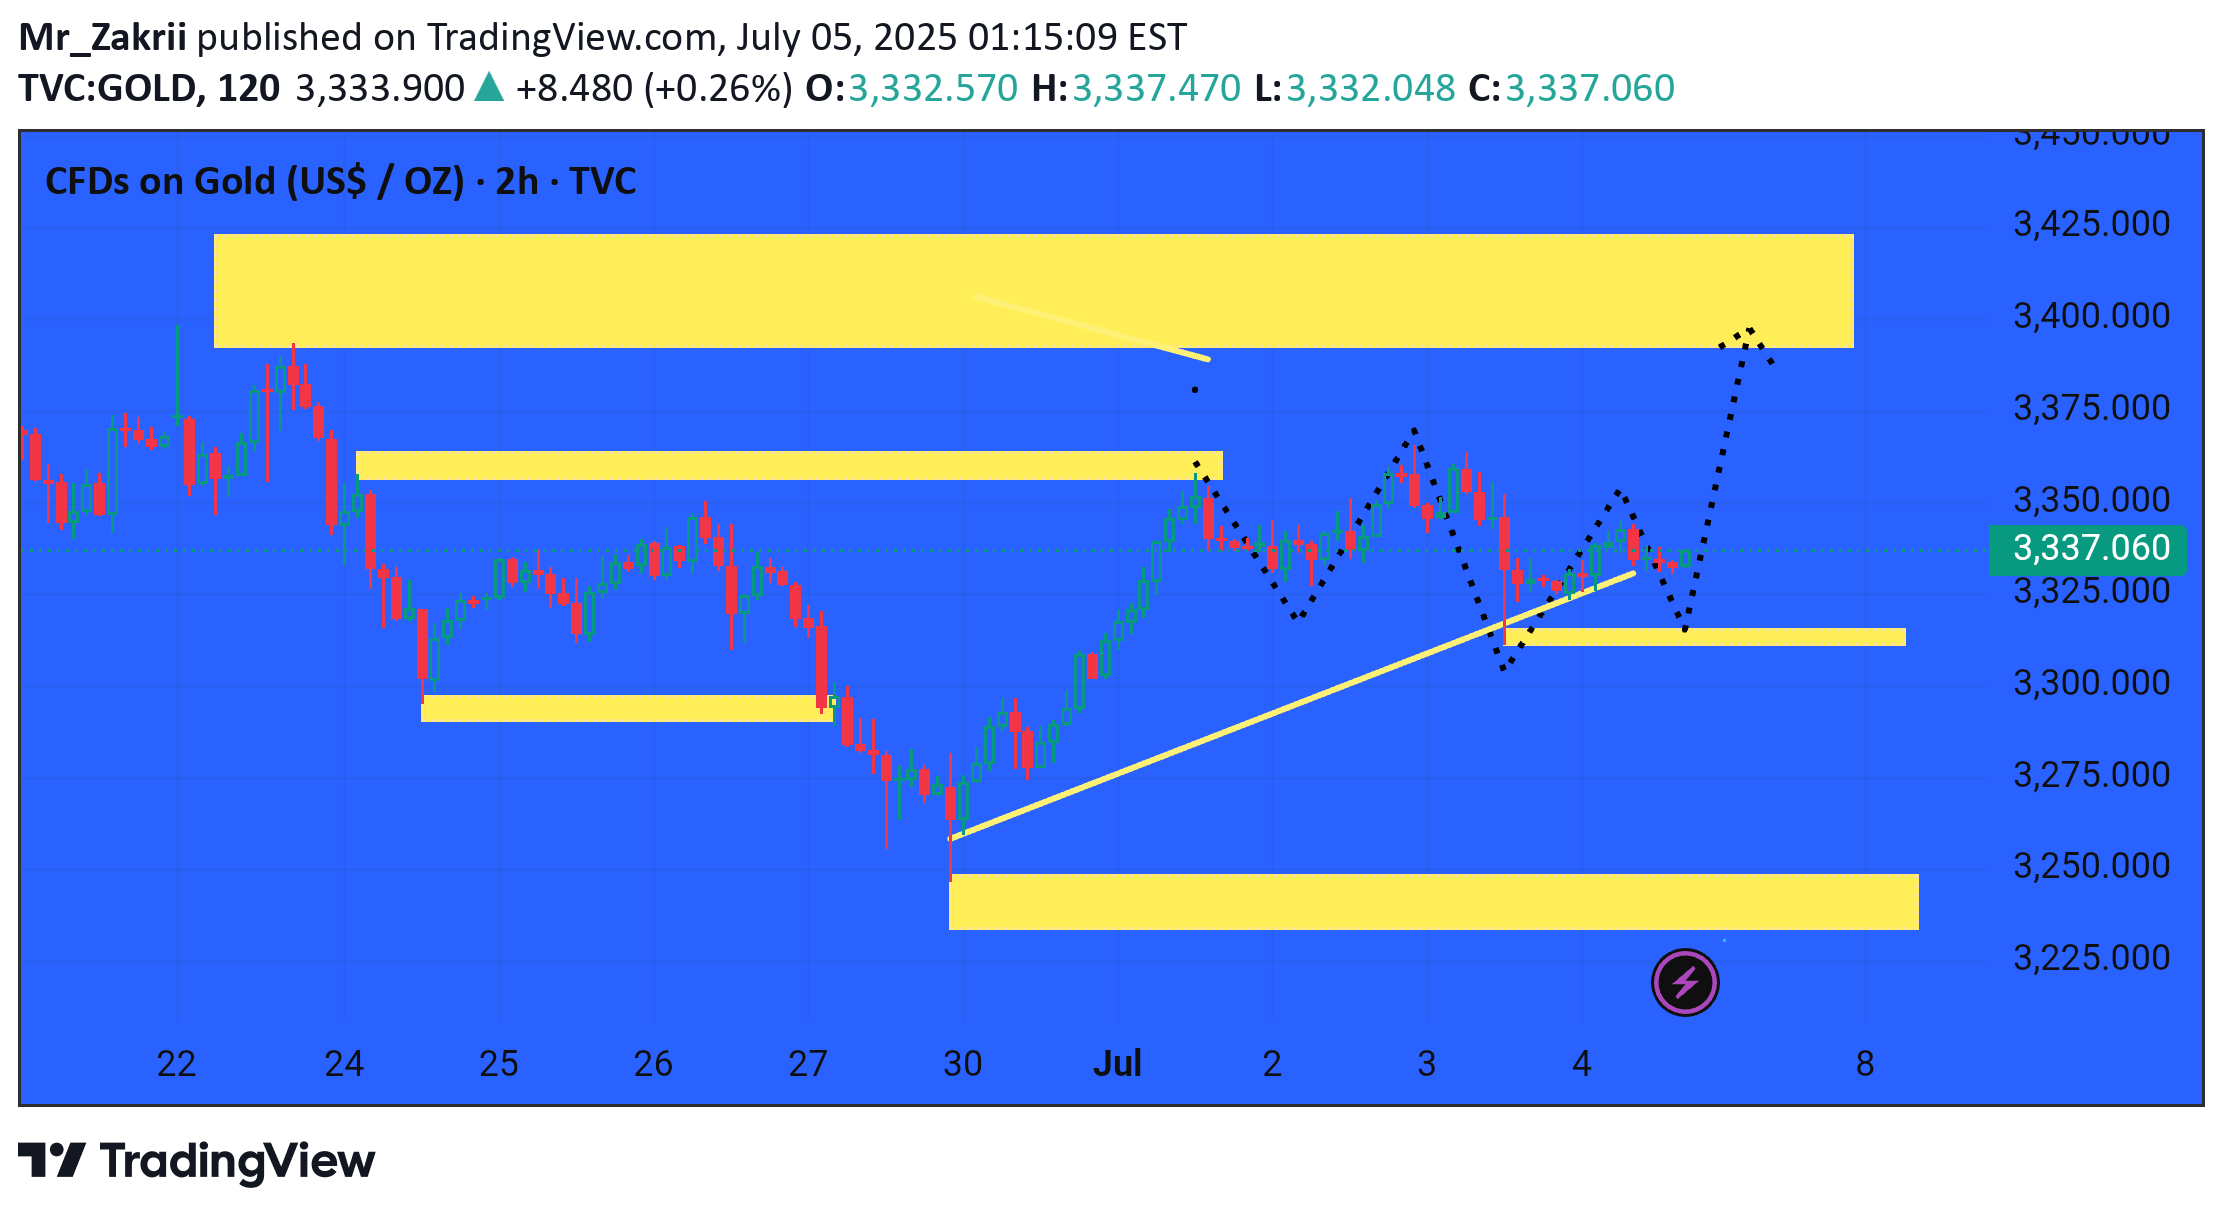
This chart shows a bullish outlook for Gold (CFDs on Gold in USD/OZ) on the 2-hour timeframe, as created on July 5, 2025. Here's a breakdown of key elements:---🔍 Technical Analysis Summary:1. Current Price: 3,337.0602. Key Zones:Support Zones:Around 3,320.000: A strong horizontal support area.Around 3,240.000: Major demand zone where a previous reversal occurred.Resistance Zones:Around 3,360.000: Minor resistance.3,400.000 – 3,440.000: Strong supply/resistance zone, likely a target area.3. Trendline Support:An ascending trendline supports the bullish structure, connecting recent higher lows.4. Expected Price Movement:The dotted black arrows show two potential bullish scenarios:Scenario 1: A short pullback to the trendline/support (~3,320) followed by a rally.Scenario 2: Continuation from current levels toward the 3,400–3,440 resistance.5. Volume/Volatility Note:The purple lightning bolt icon near the 3,240 area suggests a high-volatility point, possibly a strong reaction zone.---📈 Bullish Bias Rationale:Strong structure of higher highs and higher lows.Price respecting trendline support.Large bullish candle cluster after bottoming around June 30.Market is pushing toward untested resistance at the top yellow box.---🟢 Outlook:As long as price stays above 3,320 support and respects the rising trendline, the bias remains bullish.Break above 3,360 could trigger a rally toward 3,400–3,440.Would you like a stop-loss/take-profit suggestion based on this setup?
