Technical analysis by ScottMelker about Symbol BTC on 7/1/2025

ScottMelker
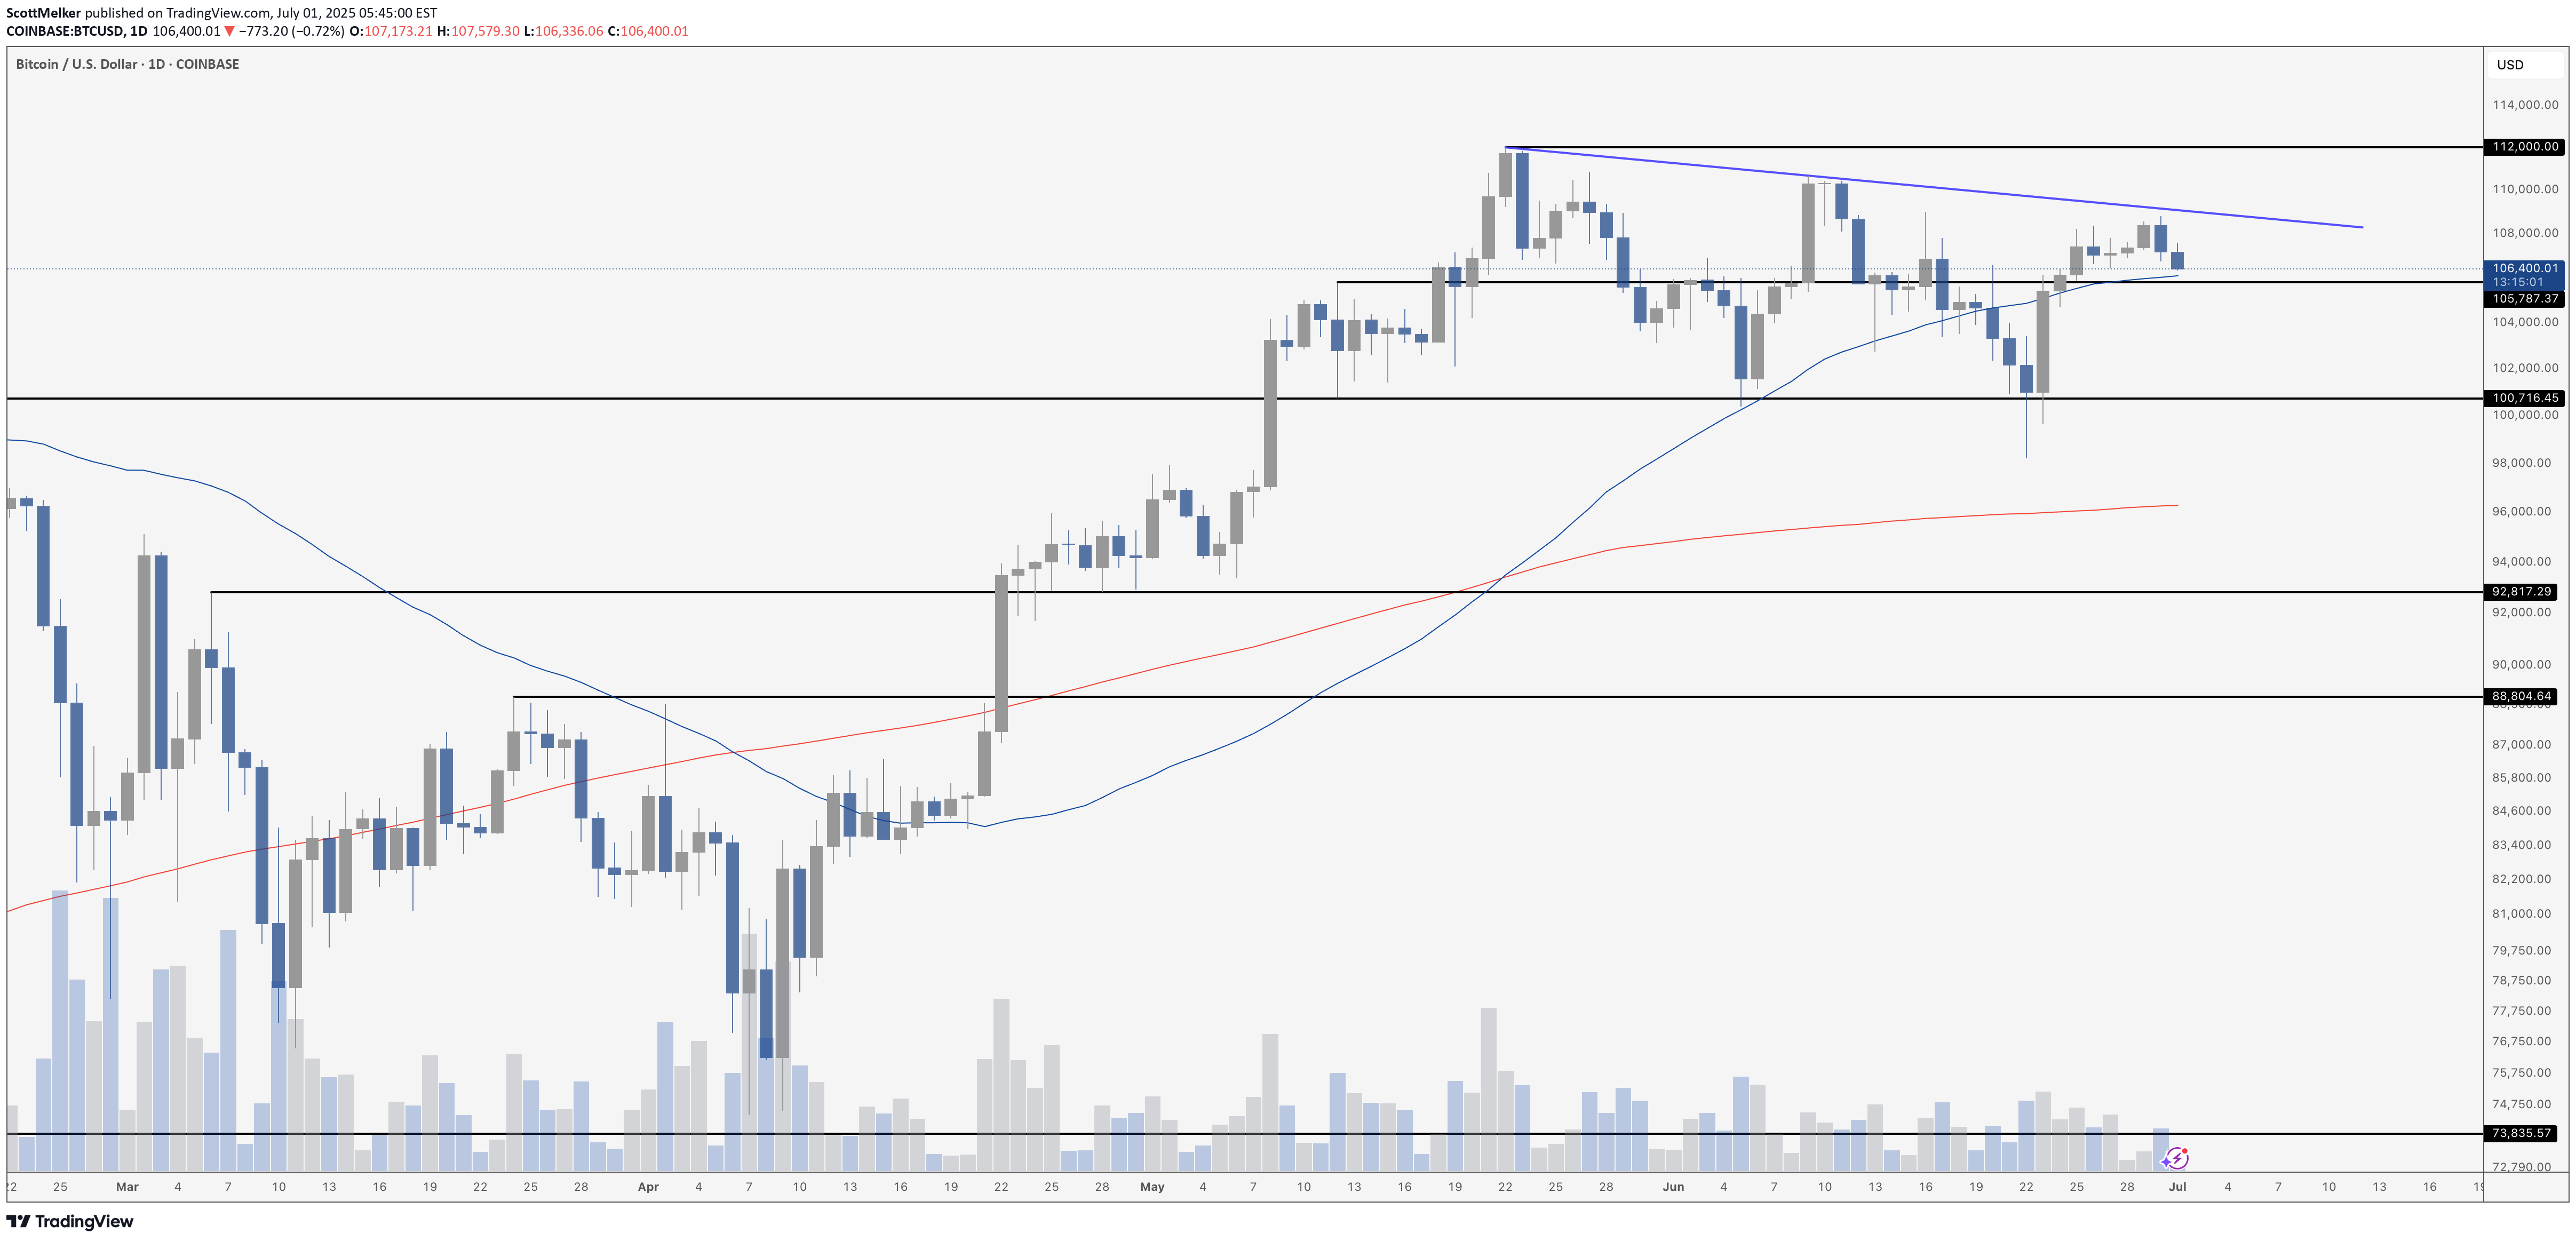
Bitcoin is currently consolidating just below a clear descending trendline, showing a series of lower highs since its recent local top near $112,000. Price is hovering around $106,300, holding just above key horizontal support at ~$105,800. This level coincides with the 50-day moving average (blue), which is currently acting as dynamic support.So far, Bitcoin has respected the ~$100,700 level as major support after the mid-June shakeout. As long as price remains above that zone and holds the 50 MA, the bullish structure remains intact despite the short-term lower highs. But the more price compresses beneath the descending resistance, the more likely we see a breakout (or breakdown) soon.The 200-day moving average (red) is well below current price action, hovering near $95,000. That’s a long way down and would likely only be tested if broader market conditions deteriorate significantly.Volume is tapering, suggesting traders are waiting for a decisive move. A break above the descending trendline and reclaim of $110,000+ would invalidate the current short-term downtrend and likely bring $112,000 and new highs into view. A loss of $105,800, on the other hand, puts $100,700 back in play – and below that, things could get ugly quickly.For now, the trend is neutral within a broader uptrend. The bulls are holding the line – but just barely
