
Magister_Arcanvm
@t_Magister_Arcanvm

ما هو الشيء الذي ننصحك بشراءه من المواد الغذائية؟
سابق في الشراء
پیام های تریدر
مرشح
نوع الإشارة
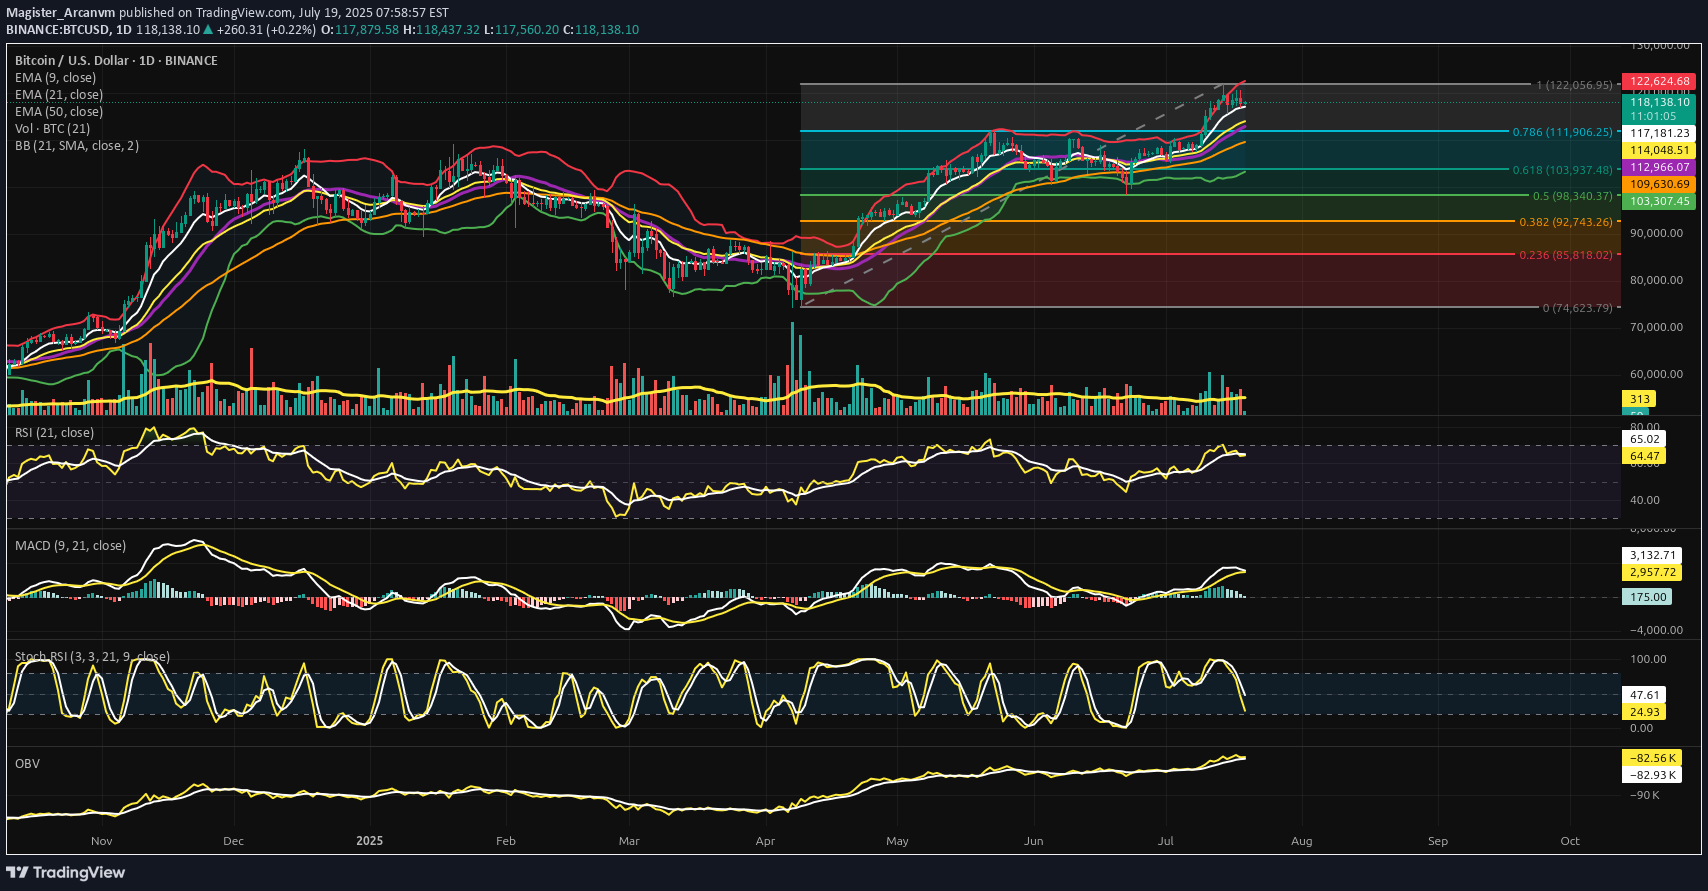
⊢ BTC/USD – BINANCE – (CHART: 1D) – (July 19, 2025). ◇ Analysis Price: $118,325.31 ⊣ ⨀ I. Temporal Axis - Strategic Interval - (1D): ▦ EMA9 - (Exponential Moving Average - 9 Close): ∴ Price is currently positioned above EMA9 at $117,218.67, confirming immediate bullish alignment; ∴ EMA9 is upward sloping and tightly hugging price candles, serving as the dominant intraday dynamic support; ∴ Every recent dip has been absorbed above or at EMA9, with no candle body close below it in the last 7 sessions. ✴️ Conclusion: Logic sealed - EMA9 holds command over short-term price structure; tactical momentum remains alive. ⊢ ▦ EMA21 - (Exponential Moving Average - 21 Close): ∴ EMA21 currently rests at $114,658.53, forming the median layer of structural trend guidance; ∴ Price action remains significantly elevated above this level, showing that bulls retain medium-range control; ∴ EMA21 has not been tested since late June, reflecting a strong upside deviation from equilibrium. ✴️ Conclusion: Logic sealed - EMA21 serves as untested trend backbone; control remains firmly in favor of buyers. ⊢ ▦ EMA50 - (Exponential Moving Average - 50 Close): ∴ EMA50 is currently located at $109,638.03, tracking long-range structural health; ∴ The moving average is gradually steepening, suggesting long-term strength and momentum acceleration; ∴ No violations or shadows have tested EMA50 since early May - reinforcing its strength as deep support. ✴️ Conclusion: Logic sealed - EMA50 anchors the structural uptrend; market remains far from long-term threat zone. ⊢ ▦ Fibonacci Retracement – (1 = $122,056.95 / 0 = $74,623.79): ∴ The full Fibonacci range spans from the April low at $74,623.79 (0.0) to the July high at $122,056.95 (1.0) - anchoring the complete structure of the current macro move; ∴ Price is now positioned at $118,325.31, precisely above the 0.786 retracement level at $111,906.25, and beneath the 1.0 top - this zone represents the “golden upper quadrant,” a region where euphoria meets exhaustion; ∴ The 0.618 level ($103,937.45) remains untouched since early June, acting as the gravitational pull of equilibrium - its preservation confirms that no structural breakdown has occurred; ✦ Additional Level Mapping: • 0.500 - $98,340.37: The neutral midpoint, remains far below - unchallenged; • 0.382 - $92,743.26: The "warning belt" for medium-term trend decay; • 0.236 - $85,818.02: A deep corrective zone, untouched and far from current price. ∴ Multiple zones of confluence exist between EMA21, BB midline, and 0.786, forming a strategic consolidation platform in the current price region; ∴ Failure to reclaim above 1.0 extension suggests bulls may be entering exhaustion while still structurally intact. ✴️ Conclusion: Logic sealed - price is trapped in the Fibonacci Gate (0.786 – 1.0); breakout requires decisive volume or reversion to golden support. ⊢ ▦ Bollinger Bands - (SMA21 / 2 Standard Deviations): ∴ The current Bollinger structure shows band expansion, not contraction - upper band is at $122,653.00, lower band at $103,296.96, midline (SMA21) at $112,974.98; ∴ Price is moving above the midline, but no longer hugging the upper band - signaling that explosive momentum has waned while structure remains bullish; ∴ Last major push toward the upper band resulted in rejection near $122k, followed by sideways compression - implying the bands are preparing to resolve a volatility coil; ✦ Interpretative Observations: • The midline (SMA21) is converging with the EMA21 and 0.786 Fib, forming a triple convergence layer - a key strategic battlefield; • The distance between bands is approximately $19,356, indicating elevated volatility, but not chaos - directional tension remains unresolved; • Band curvature suggests no imminent squeeze, but a potential for re-expansion if price reclaims upper territory. ∴ This structure shows a calm above chaos - volatility is present, but muted by the upper Fibonacci gate and internal exhaustion. ✴️ Conclusion: Logic sealed - volatility bands are wide and reactive, signaling buildup pressure; the next directional breach will likely define the next 30-day trend. ⊢ ▦ Volume + EMA21 - (Volume Activity and Trend Average): ∴ The latest daily volume candle stands at 312 (unit scale), notably below the Volume EMA21, which trends around 418 - indicating waning participation post-breakout; ∴ The most recent breakout above $120k was accompanied by a singular spike in volume, followed by five consecutive days of volume decay - a typical exhaustion profile without follow-through; ∴ There has been no bullish volume expansion to defend price levels above $118k, suggesting that the upward move is unsupported by fresh demand; ✦ Tactical Observations: • Volume is currently below the average trend line, which implies a lack of conviction on both sides - a vacuum state; • The EMA21 of volume acts as a barometer of trend health - its breach to the downside indicates structural weakening beneath a seemingly bullish price; • The low volume + high price condition signals silent divergence, often a precursor to compression, reversal, or manipulation. ∴ Price is elevated but unsupported, indicating the presence of “surface strength, internal fragility.” ✴️ Conclusion: Logic sealed - declining volume below trend average confirms demand fatigue; continuation is suspect without new influx. ⊢ ▦ RSI (21) + EMA9 - (Relative Strength Index with Signal Smoothing): ∴ The RSI (21) reads at 64.72, having pulled back from a recent high near 74, suggesting a transition from euphoric thrust to reflective consolidation; ∴ The RSI line has dipped below its EMA9 signal, forming a soft negative crossover, typically interpreted as a waning of short-term momentum; ∴ Despite the loss of angle, RSI remains comfortably above the 50-line, which acts as the threshold between bullish continuation and structural deterioration; ✦ Interpretative Layers: • The EMA9 of RSI functions here as a short-term momentum oscillator overlay - its breach confirms weakening, not reversal; • RSI holding above 60 implies the presence of continued buy-side pressure - though fading; • The divergence between price (near high range) and RSI (descending) establishes the groundwork for potential hidden weakness. ∴ RSI shows the archetype of a post-breakout exhaustion slope, yet refuses to break structurally - a signal of suspended momentum, not decay. ✴️ Conclusion: Logic sealed - momentum is cooling but not reversing; bulls remain structurally in control while energy dissipates. ⊢ ▦ Stochastic RSI (3,3,21,9) - (Momentum Cycle Oscillator): ∴ The current values are: %K = 26.27, %D = 48.05 - showing a completed bearish crossover, with %K trailing beneath %D; ∴ The oscillator has already dipped into oversold (<20) and is now rebounding, yet fails to regain dominance over the signal line - this marks a failed bullish recovery pattern; ∴ Recent structure shows multiple failed attempts to reclaim high-band cycles, indicating that short-term traders are exiting, while major holders observe; ✦ Tactical Interpretations: • The system has transitioned from bullish impulsive to corrective reflective - momentum is coiling instead of thrusting; • The flattening of %D around the midline reflects indecision in micro-timeframe velocity; • The double-rejection of %K near 80 last week forms a tactical top signal under stochastic doctrine. ∴ This oscillator, sensitive to short-term flows, declares the loss of tactical initiative by the bulls. ✴️ Conclusion: Logic sealed - short-term momentum cycle is decaying; the structure now favors consolidation or soft pullback. ⊢ ▦ MACD (9,21) - (Moving Average Convergence Divergence): ∴ Current MACD line: (+2,961.80), Signal line: (+3,153.14) - indicating an active bearish crossover, as the MACD line has dropped below the signal; ∴ Histogram bars are negative and expanding, a key sign that downward momentum is growing, even as price remains elevated; ∴ This crossover has occurred at a relatively high amplitude, meaning the pullback potential is non-trivial - it is not a shallow fluctuation, but a structural transition; ✦ Structural Implications: • The bearish crossover happened after divergence with price action - while Bitcoin reached new highs, MACD momentum did not, forming a classical bearish divergence; • Momentum began decaying several sessions before price peaked - the indicator warned of exhaustion before price responded; • The slope of the MACD line has steepened downward - a sign of gathering corrective force. ∴ This marks the first true warning from the momentum engine beneath the price - a shift from thrust to counter-pressure. ✴️ Conclusion: Logic sealed - MACD confirms structural momentum exhaustion; corrective forces are now in motion, though price has yet to reflect full impact. ⊢ ▦ OBV + EMA9 - (On-Balance Volume with Trend Smoothing): ∴ Current OBV stands at (–82.93K), now below its EMA9, which reads (–82.57K) - indicating a loss of volume-weighted trend force from the buyers; ∴ While price remains elevated, OBV has been descending gradually, forming a clear bearish divergence between volume flow and price action; ∴ Over the last 7 daily sessions, OBV has failed to form any new high - even as BTC printed a new price peak - revealing that volume is silently exiting the market; ✦ Interpretative Reading: • OBV below EMA9 confirms that cumulative volume pressure is negative - this undermines surface-level price strength; • Divergence with price often precedes major pivot zones - the “hidden drain” effect; • The OBV curve is now sloping downward with consistency, indicating that larger hands may be distributing while price remains deceptive. ∴ This structure carries the seal of silent distribution, a hallmark of late-cycle phases in bullish trends. ✴️ Conclusion: Logic sealed - OBV confirms internal outflow; market strength is no longer aligned with volume reality. ⊢ 🜎 Strategic Insight – Technical Oracle: ∴ The 1D structural framework remains formally bullish, as price holds firmly above all exponential anchors (EMA9, 21, 50) and resides within the golden quadrant of the Fibonacci matrix; ∴ However, a triad of momentum signals - MACD, Stochastic RSI, and OBV - are all flashing early warnings of underlying exhaustion; ∴ The market breathes the air of height, yet the blood of energy runs thin; ∴ Volume no longer fuels ascent - momentum coils, not climbs; ∴ The surface remains calm, but the substructure contracts in silence; ∴ This is a phase of strategic suspension; ∴ Not yet a reversal - but no longer thrusting forward; ∴ A condition of uptrend fatigue, awaiting external force or internal reset. ✴️ Conclusion: The Oracle speaks - the trend is structurally preserved, but internally untrustworthy. The next move, when it comes, will be definitive. ⊢ ▦ Structurally: Bullish. ∴ Price remains well above EMA50, EMA21, and EMA9; ∴ No bearish cross has occurred; ∴ Structure is elevated within upper Fibonacci zones - not broken. ⊢ ▦ Momentum-wise: Bearish Divergence. ∴ MACD has crossed bearishly; ∴ OBV is declining despite price holding high; ∴ RSI and Stoch RSI confirm exhaustion. ⊢ ✴️ Final Codex Interpretation: ∴ Structurally Bullish - Tactically Suspended; ∴ The frame holds, but the fuel has faded; ∴ Bulls possess the hilltop - but lack fire to advance; ∴ A breach or retreat shall define the next archetype. ⊢ ⧉ · Cryptorvm Dominvs · MAGISTER ARCANVM · Vox Primordialis · ⚜️ ⌬ - Wisdom begins in silence. Precision unfolds in strategy - ⌬ ⚜️ ⧉ ⊢
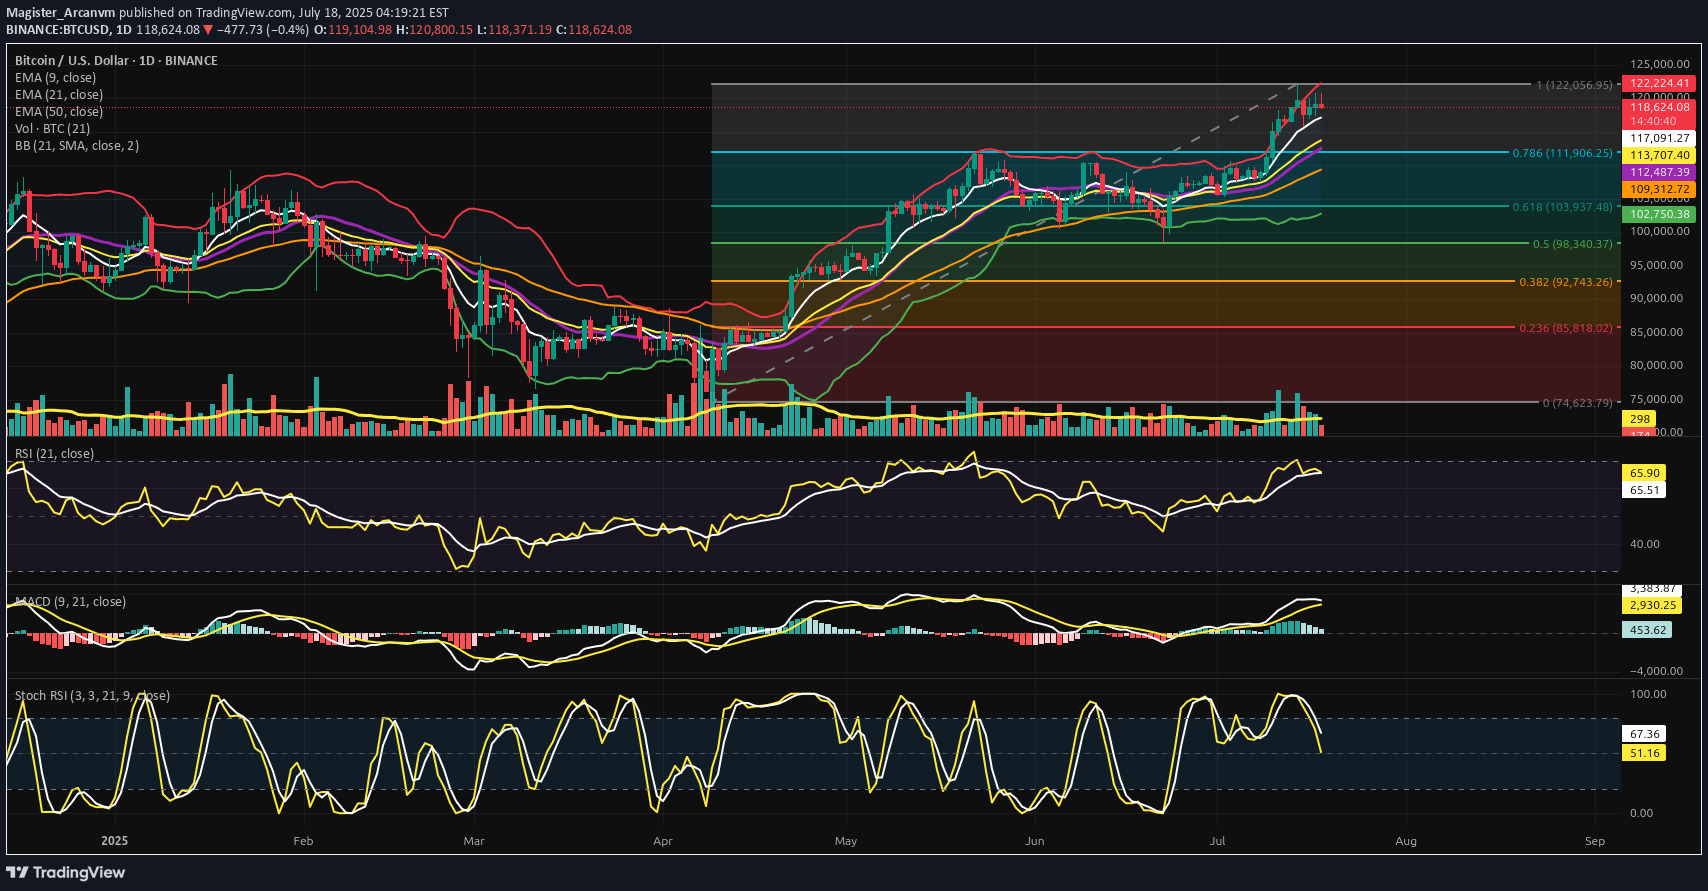
⊣ ⟁ BTC/USD - BINANCE - (CHART: 1D) - (Jul 18, 2025). ◇ Analysis Price: $118,866.60. ⊣ ⨀ I. Temporal Axis - Strategic Interval - (1D): ▦ EMA9 - (Exponential Moving Average - 9 Close): ∴ EMA9 is currently positioned at $119,077.81, closely tracking the current price, acting as dynamic micro-support; ∴ The slope of EMA9 remains upward, with price consistently closing above it in the past sessions; ∴ Compression candles are forming above this line, suggesting it is being defended as a tactical floor. ✴️ Conclusion: EMA9 is structurally supportive, signaling short-term bullish control beneath compression. ⊣ ▦ EMA21 - (Exponential Moving Average - 21 Close): ∴ EMA21 is placed at $118,537.29 and holds a clear upward slope; ∴ Recent pullbacks have tested the region near EMA21 but failed to close beneath it; ∴ EMA21 is establishing itself as the primary mid-range buffer zone within this bullish phase. ✴️ Conclusion: EMA21 confirms intermediate momentum preservation and mid-term trend integrity. ⊢ ▦ EMA50 - (Exponential Moving Average - 50 Close): ∴ EMA50 is located at $116,804.80 and remains untouched during the current rally phase; ∴ The distance between EMA21 and EMA50 is widening, confirming structural momentum; ∴ This line now functions as the lower tier of the bullish envelope - a defensive anchor. ✴️ Conclusion: EMA50 reflects resilient bullish understructure and rising support basin. ▦ Fibonacci Retracement - (ATH = $122,056.95 / Low = $74,623.79): ∴ Price is currently positioned just under the 0.786 level, a classic tension zone before ATH retests; ∴ The 0.618 level has already been claimed and held as support, showing strength through key retracements; ∴ The market is coiling between 0.786 and 1.000 in preparation for decisive expansion or rejection. ✴️ Conclusion: BTC sits within the golden gate - structurally pressurized near final resistance thresholds. ⊢ ▦ Bollinger Bands: ∴ Bands are visibly contracting, forming a volatility funnel around the current price zone; ∴ The price is maintaining proximity to the upper band without closing beyond it; ∴ The base band remains far beneath ($116k zone), indicating untriggered potential. ✴️ Conclusion: Volatility is compressing structurally; directional resolution is imminent. ⊢ ▦ Volume + EMA21: ∴ Volume bars have declined steadily during this upper-range consolidation; ∴ EMA21 on volume confirms weakening participation relative to early July moves; ∴ Absence of breakout-volume suggests either stealth accumulation or passive stalling. ✴️ Conclusion: Volume behavior is non-confirmatory - the structure floats without conviction. ⊢ ▦ RSI - (21) + EMA9: ∴ RSI(21) currently prints 60.45, above its own EMA9 at 59.41, suggesting net upward pressure; ∴ The RSI slope remains neutral-to-positive without entering overbought; ∴ The absence of bearish divergence confirms internal momentum coherence. ✴️ Conclusion: RSI structure is clean, moderate, and aligned with sustainable trend energy. ⊢ ▦ Stochastic RSI - (3,3,21,9): ∴ K = 78.78 | D = 71.55 - both above 70, nearing the overbought ceiling; ∴ The fast line (K) shows minor inflection but no confirmed cross; ∴ Momentum is elevated, but historical context shows price can remain extended. ✴️ Conclusion: Momentum is entering saturation zone - caution on short-term exhaustion. ⊢ ▦ MACD - (9,21): ∴ MACD line (540.52) remains above the signal line (414.93) in sustained bullish crossover; ∴ The histogram has begun flattening, indicating reduced acceleration; ∴ There is no bearish cross yet, but momentum build is slowing. ✴️ Conclusion: MACD supports bullish continuation, but thrust intensity is decaying. ⊢ ▦ OBV + EMA9: ∴ OBV reads 71.13M and is currently flat, with no new highs in accumulation; ∴ EMA9 on OBV closely hugs the raw OBV line, confirming stagnation; ∴ Prior upward surges in OBV are not being extended, showing tactical pause in conviction. ✴️ Conclusion: Liquidity expansion has halted; OBV structure is tactically neutral. ⊢ 🜎 Strategic Insight - Technical Oracle: ∴ The BTC/USD structure is entering a compressed apex between structural momentum (EMA stack, RSI, MACD) and tactical exhaustion signals (Stochastic RSI, Bollinger Band constriction, flattening OBV); ∴ Price is stabilizing just beneath the ATH gate ($122,056), indicating a threshold scenario - where breakout and rejection probabilities are approaching parity; ∴ Volume decline reflects the absence of forced participation, and suggests that the next move will be event-triggered or liquidity-engineered. The current environment favors volatility re-expansion, not trend reversal; ✴️ This is a threshold phase: structurally bullish, tactically suspended, awaiting ignition. ⊢ ∫ II. On-Chain Intelligence – (Source: CryptoQuant): ▦ Exchange Netflow Total + EMA9: ∴ Current Netflow: -938 Bitcoins - sustained negative flow over time indicates coins leaving exchanges; ∴ Persistent outflows reflect holding sentiment and reduced immediate sell pressure; ∴ Price action shows historical upside alignment when netflows remain negative across clusters. ✴️ Conclusion: Exchange behavior signals macro holding bias, not liquidation cycles. ⊢ ▦ Binary CDD + EMA9: ∴ Binary CDD has spiked into high activity zones in the past week, showing awakened dormant coins; ∴ This metric historically precedes localized tops when synchronized with weak flows; ∴ However, no consistent clusters are forming - signals remain scattered. ✴️ Conclusion: Binary CDD reflects isolated movements, not systemic awakening or distribution. ⊢ ▦ Exchange Whale Ratio + EMA9: ∴ Current ratio hovers at ~0.62 - elevated but not extreme; ∴ Sustained whale activity near 0.60+ can precede volatility events; ∴ Trendline is rising since May, showing gradual uptick in dominance from top senders. ✴️ Conclusion: Whale activity is tactically elevated, implying latent strategic intent. ⊢ ▦ Supply-Adjusted Dormancy + EMA9: ∴ Dormancy values are near historical lows, indicating old coins are staying inactive; ∴ EMA9 confirms a downward trend in dormant supply movement; ∴ Long-term holders are not distributing at this level. ✴️ Conclusion: Structural dormancy supports holder conviction - no exit signals from old supply. ⊢ ▦ Realized Cap + EMA9: ∴ Realized Cap is now exceeding $1T, rising consistently without parabolic spikes; ∴ EMA(9) and line are in lockstep - a healthy ascent; ∴ No acceleration = no blow-off = sustainable revaluation. ✴️ Conclusion: Value accumulation remains organic, not euphoric. ⊢ ▦ MVRV Ratio + EMA9: ∴ MVRV sits at 2.36 - below historical overvaluation levels (>3.0); ∴ EMA(9) confirms gradual slope upward, consistent with price; ∴ Ratio is not overheated - risk/reward remains structurally favorable. ✴️ Conclusion: MVRV indicates non-euphoric regime - mid-phase of value appreciation. ⊢ ▦ BTC vs GOLD vs S&P500 - (BGemetrix Comparative Graph): ∴ BTC continues to outperform both GOLD and SPX in long-term slope, even after corrections; ∴ Current phase shows GOLD flattening and SPX slightly lagging BTC in verticality; ∴ This divergence hints at BTC leading in speculative rotation while traditional assets stabilize. ✴️ Conclusion: BTC holds macro-dominance position, operating as the apex volatility proxy in current intermarket structure. ⊢ 🜎 Strategic Insight - On-Chain Oracle: ∴ Despite short-term compression, the on-chain structure reveals no distribution threats; ∴ Holder conviction, realized valuation, and MVRV slope all suggest controlled structural appreciation, not mania; ∴ Whales are tactically present, but dormancy and exchange flows confirm no mass exit; ∴ This is an internally coherent, tactically patient regime. ✴️ Bitcoin is preparing, not peaking. ⊢ 𓂀 Stoic-Structural Interpretation: ▦ Structurally Bullish - Tactically Suspended: ∴ All key EMA's (9/21/50) are stacked and rising; price remains elevated yet non-parabolic; ∴ Fibonacci apex is active, with price compressing beneath the ATH zone ($122,056), not retreating; ∴ On-chain intelligence confirms long-term conviction, with no distribution from whales or dormants. ✴️ Conclusion: The system retains structural strength; pressure is latent, not expired. The architecture is bullish, not euphoric. ⊢ ▦ Tactical Range Caution: ∴ Stochastic RSI and MACD show early-stage exhaustion; ∴ Volume has declined into apex, favoring liquidity traps or volatility bursts; ∴ Whale Ratio elevation implies pre-positioning behavior, not public confirmation. ✴️ Conclusion: Tactical maneuvering is dominant. Breakout potential exists but is not trustable until confirmed by volume and displacement. ⊢ ⧉ Cryptorvm Dominvs · ⚜️ MAGISTER ARCANVM ⚜️ · Vox Primordialis ⌬ - Wisdom begins in silence. Precision unfolds in strategy - ⌬ ⧉ ⊢⊣ ⟁ BTC/USD - BINANCE - (CHART: 1D) - (July 18, 2025): ⊣ ⨀ I. Temporal Axis - Strategic Interval - (1D): Corrected indicators below: ▦ RSI - (21) + EMA9: ∴ RSI = 66.97 | EMA9(RSI) = 65.72 - both climbing; ∴ RSI is closer to overbought zone than in the H4 view; ∴ No divergence is present, but proximity to resistance warrants caution. ✴️ Conclusion: RSI remains structurally sound, with slight tension emerging near upper bounds. ⊢ ▦ MACD - (9,21): ∴ MACD Line = 3,431.11 | Signal Line = 2,939.70 - strong bullish gap persists; ∴ Histogram is rising, unlike the flat pattern in the H4 chart; ∴ Structural momentum is intact and increasing. ✴️ Conclusion: MACD shows reinforced bullish thrust from the base - momentum remains intact. ⊢ ▦ Stochastic RSI - (3,3,21,9): ∴ K = 58.47 | D = 69.80 - both lines now crossing downward, exiting overbought; ∴ This descending structure is clearer on the 1D chart, marking a momentum slowdown; ∴ The D > K crossover confirms loss of short-term thrust. ✴️ Conclusion: Tactical momentum is clearly fading - structure holds, but impulse is weakening. ⊢
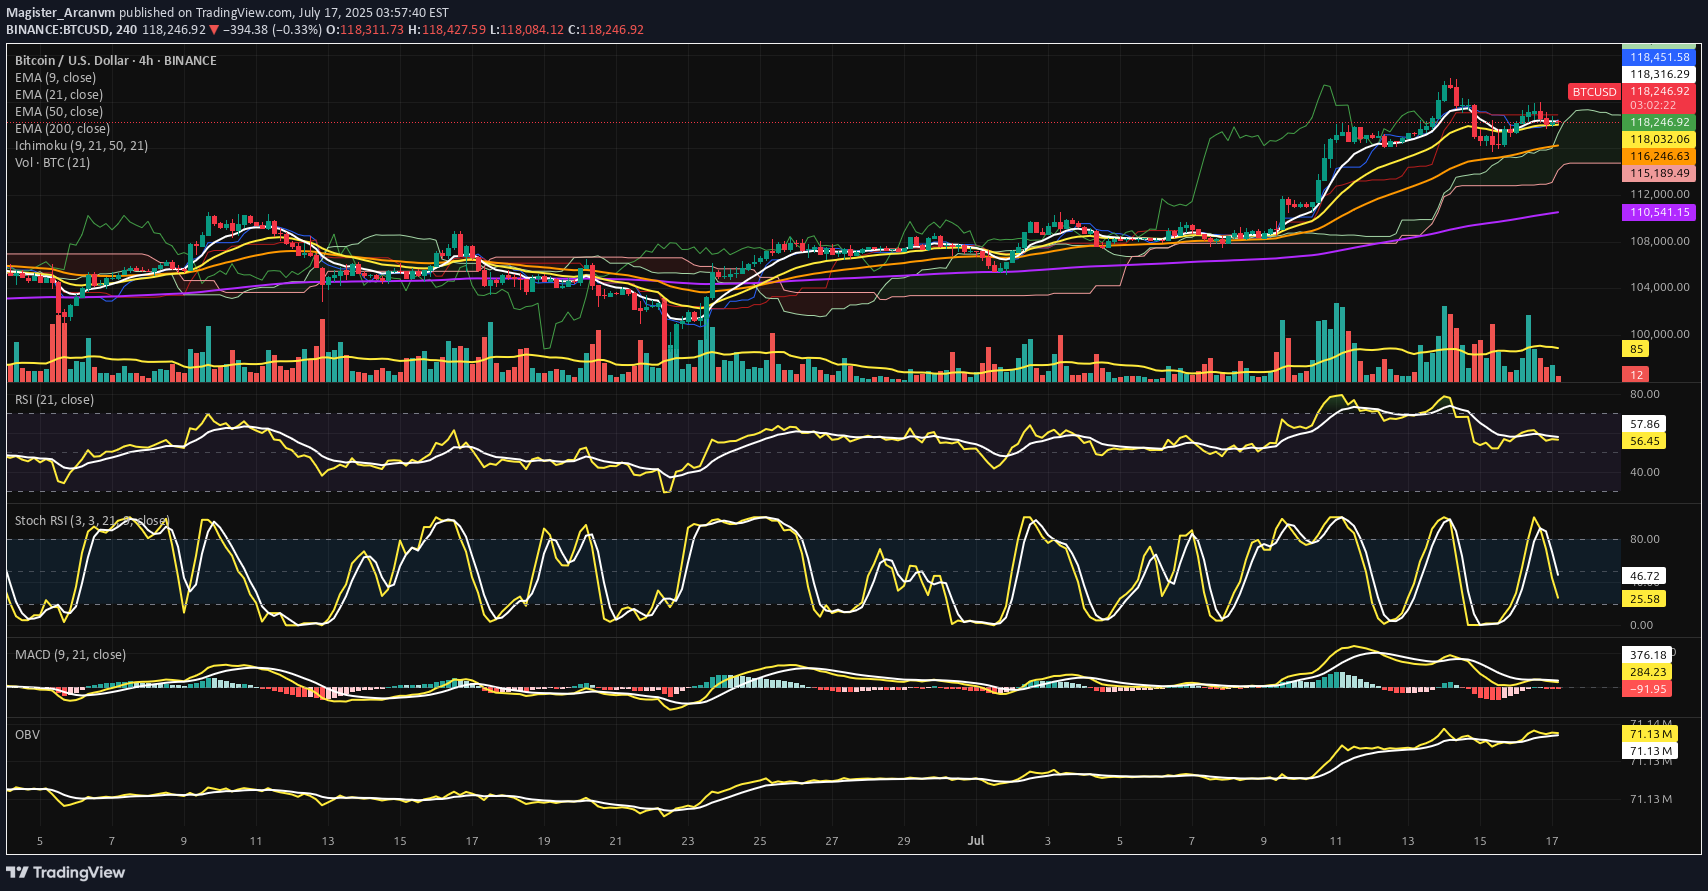
⊣ ⟁ BTC/USD - BINANCE - (CHART: 4H) - (July 17, 2025). ◇ Analysis Price: $118,099.62. ⊣ ⨀ I. Temporal Axis - Strategic Interval – (4H): ▦ EMA9 - (Exponential Moving Average - 9 Close): ∴ EMA9 is currently positioned at $118,286.83, marginally above the current price of $118,099.62; ∴ The slope of the EMA9 has begun to turn sideways-to-downward, indicating loss of short-term acceleration; ∴ The price has crossed below EMA9 within the last two candles, suggesting an incipient rejection of immediate bullish continuation. ✴️ Conclusion: Short-term momentum has weakened, positioning EMA 9 as immediate dynamic resistance. ⊢ ▦ EMA21 - (Exponential Moving Average - 21 Close): ∴ EMA21 is measured at $118,018.67, positioned slightly below both price and EMA9, indicating a recent tightening of trend structure; ∴ The slope of EMA21 remains positive, preserving the medium-range bullish structure intact; ∴ EMA21 has been tested multiple times and held as support since July 15 - confirming tactical reliability as dynamic floor. ✴️ Conclusion: EMA21 stands as a critical pivot zone; any sustained breach would denote structural stress. ⊢ ▦ EMA50 - (Exponential Moving Average - 50 Close): ∴ EMA50 is currently located at $116,240.85, well below current price action; ∴ The curve maintains a healthy positive inclination, affirming preservation of broader intermediate trend; ∴ No contact or proximity to EMA50 over the last 20 candles - indicating strong bullish detachment and buffer zone integrity. ✴️ Conclusion: EMA50 confirms medium-term bullish alignment; not yet challenged. ⊢ ▦ EMA200 - (Exponential Moving Average - 200 Close): ∴ EMA200 stands at $110,539.69, forming the base of the entire 4H structure; ∴ The gradient is gradually rising, reflecting accumulation over a long time horizon; ∴ The distance between price and EMA200 reflects extended bullish positioning, yet also opens risk for sharp reversion if acceleration collapses. ✴️ Conclusion: Long-term structure remains bullish; early signs of overextension exist. ⊢ ▦ Ichimoku Cloud - (9, 21, 50, 21): ∴ Price is currently above the Kumo (cloud), placing the pair within a bullish regime; ∴ Tenkan-sen (conversion) and Kijun-sen (base) lines show narrowing separation, suggesting momentum compression; ∴ Senkou Span A > Span B, and the cloud ahead is bullishly twisted, though thinning - indicating potential vulnerability despite structural advantage. ✴️ Conclusion: Bullish regime intact, but loss of momentum and cloud compression warrant caution. ⊢ ▦ Volume + EMA21: ∴ Current volume for the latest candle is 3 BTC, compared to the EMA21 of 84 BTC; ∴ This indicates an extremely low participation phase, often associated with distribution zones or indecisive consolidation; ∴ Previous impulsive candles (July 15) reached well above 100 BTC - the current contraction is stark and strategically significant. ✴️ Conclusion: Absence of volume threatens trend continuation; energy depletion apparent. ⊢ ▦ RSI - (21) + EMA9: ∴ RSI (21) is positioned at 55.73, marginally above neutral zone; ∴ EMA 9 of RSI is 57.71, crossing downward against RSI - bearish micro signal; ∴ No divergence is present versus price action - oscillator confirms current stagnation rather than exhaustion. ✴️ Conclusion: RSI losing strength above neutral; lacks momentum for breakout, but no capitulation. ⊢ ▦ Stoch RSI - (3,3,21,9): ∴ %K is 21.44, %D is 45.34 - both pointing downward, in deacceleration phase; ∴ Recent rejection from overbought zone without full reset into oversold - signaling weak bullish thrust; ∴ Historical cycles show rhythmical reversals near current levels, but only with supportive volume, which is absent now. ✴️ Conclusion: Short-term momentum failed to sustain overbought breakout - micro-correction expected. ⊢ ▦ MACD - (9, 21): ∴ MACD line is at -104.80, Signal line at 268.16 - large separation, histogram deeply negative; ∴ The bearish crossover occurred with declining volume, implying fading momentum rather than aggressive sell-off; ∴ No bullish divergence formed yet - continuation of correction remains technically favored. ✴️ Conclusion: MACD confirms trend exhaustion; no reversal in sight. ⊢ ▦ OBV + EMA 9: ∴ OBV is 71.13M, perfectly aligned with its EMA9 - indicating equilibrium in volume flow; ∴ No directional bias in accumulation or distribution - flatlining suggests passive environment; ∴ Prior OBV uptrend has stalled since July 15 - reinforcing narrative of hesitation. ✴️ Conclusion: Institutional flow is neutral; no aggressive positioning detected. ⊢ 🜎 Strategic Insight - Technical Oracle: The current price structure presents a classic post-impulse compression configuration within a preserved bullish environment. Despite the higher timeframe alignment, multiple short-term indicators exhibit tactical dissonance and signs of momentum decay. This inconsistency reflects a market caught between structural optimism and tactical hesitation. ♘ Key strategic signals - Structural Alignment: ∴ All major EMA's (9, 21, 50, 200) remain stacked in bullish order with no bearish crossovers imminent; ∴ Price remains above the Ichimoku Cloud and above EMA50 - both confirming structural dominance by buyers. ♘ Momentum Degradation: ∴ RSI (21) is drifting below its EMA9, weakening the momentum required for further upside continuation; ∴ Stochastic RSI has rolled over aggressively, failing to reach oversold before reversing - mid-cycle weakness is confirmed. ♘ Volume Collapse: ∴ The current volume profile is critically weak - 3 Bitcoin against an average of 84 Bitcoins (EMA21); ∴ Price attempting to sustain above EMA's with no conviction signals distribution or passivity. ♘ MACD & OBV: ∴ MACD histogram remains deep in negative territory, and no bullish crossover is visible; ∴ OBV is flat - neither accumulation nor distribution dominates, leaving directional thrust suspended. ✴️ Oracle Insight: ∴ The technical field is Structurally Bullish, but Tactically Compressed. ∴ No breakout should be expected unless volume decisively returns above baseline (84 Bitcoins EMA); ∴ Below $117,800, the structure risks transition into a corrective phase; ∴ Above $118,450, potential trigger zone for bullish extension if accompanied by volume surge. ♘ Strategic posture: ∴ Wait-and-observe regime activated; ∴ No entry condition satisfies both structure and momentum at present; ∴ Tactical neutrality is advised until confirmation. ⊢ ∫ II. On-Chain Intelligence - (Source: CryptoQuant): ▦ Exchange Reserve - (All Exchanges): ∴ The total Bitcoin reserves held on all exchanges continue a sharp and uninterrupted decline, now at ~2.4M BTC, down from over 3.4M in mid-2022; ∴ This downtrend has accelerated particularly after January 2025, with a visible drop into new lows - no accumulation rebound observed; ∴ Historically, every prolonged depletion of exchange reserves correlates with structural bullish setups, as supply becomes increasingly illiquid. ✴️ Conclusion: On-chain supply is structurally diminishing, confirming long-term bullish regime intact - mirrors technical EMA alignment. ⊢ ▦ Fund Flow Ratio - (All Exchanges): ∴ Current Fund Flow Ratio stands at 0.114, which is well below historical danger thresholds seen near 0.20-0.25 during local tops; ∴ The ratio has remained consistently low throughout the 2025 uptrend, indicating that on-chain activity is not directed toward exchange-based selling; ∴ Spikes in this indicator tend to precede local corrections - but no such spike is currently present, reinforcing the notion of non-threatening capital flow. ✴️ Conclusion: Capital is not rotating into exchanges for liquidation - volume weakness seen in 4H chart is not linked to sell intent. ⊢ ▦ Miners' Position Index - (MPI): ∴ The MPI sits firmly below the red threshold of 2.0, and currently ranges in sub-neutral levels (~0.5 and below); ∴ This suggests that miners are not engaging in aggressive distribution, and are likely retaining Bitcoin off-exchange; ∴ Sustained low MPI readings during price advances confirm alignment with institutional and long-term accumulation behavior. ✴️ Conclusion: Miner behavior supports structural strength - no mining-induced supply pressure present at this stage. ⊢ 🜎 Strategic Insight - On-Chain Oracle: ∴ Across the three strategic indicators, no on-chain evidence supports short-term weakness; ∴ Supply is declining - (Exchange Reserve ↓); ∴ Funds are not preparing for exit - (Flow Ratio stable); ∴ Miners are not selling - (MPI subdued). ✴️ This constellation reinforces the thesis of Structural Bullishness with Tactical Compression, and suggests that any pullback is not backed by foundational stress. ⊢ 𓂀 Stoic-Structural Interpretation: ∴ The multi-timeframe EMA stack remains intact and aligned - (9 > 21 > 50 > 200); ∴ Price floats above Ichimoku Cloud, and above EMA21 support, confirming elevated positioning within a macro bull channel; ∴ On-chain metrics confirm supply contraction, miner retention, and absence of fund rotation toward exchanges - structure remains sovereign; ∴ RSI - (21) slips under its EMA9 with low amplitude, indicating absence of energetic flow; ∴ Stoch RSI fails to reset fully and points downward - suggesting premature momentum decay; ∴ MACD histogram remains negative, while volume is significantly beneath EMA baseline (3 BTC vs 84 BTC); ∴ Price faces resistance at Kijun-sen ($118.451), acting as tactical ceiling; no breakout signal detected. ⊢ ✴️ Interpretatio Finalis: ∴ Structural integrity remains unshaken - the architecture is bullish; ∴ Tactically, however, the battlefield is fogged - silence reigns in volume, hesitation in oscillators; ∴ A true continuation requires volume resurrection and resolution above $118,450. Until then, neutrality governs the edge. ⊢ ⧉ Cryptorvm Dominvs · ⚜️ MAGISTER ARCANVM ⚜️ · Vox Primordialis ⌬ - Wisdom begins in silence. Precision unfolds in strategy - ⌬ ⧉ ⊢
⊣ ⟁ BTC/USD - Binance - (الرسم البیانی: 1D) - (14 یولیو ، 2025). ◇ سعر التحلیل: 121،662.29 دولار. ⊣ ⨀ I. المحور الزمنی - الفاصل الزمنی الاستراتیجی - (1D): ▦ EMA9 - (115،313.08 دولار): ∴ یتم منحدر EMA9 بقوة للأعلى ، ویکون بمثابة دعم دینامیکی خلال مرحلة التوسع الأخیرة. ✴ الخلاصة: مؤکد السیطرة الصعودیة ؛ یتم توجیه الزخم بإحکام بواسطة مرساة EMA9. ⊣ ▦ EMA21 - (111،636.30 دولار): ∴ یظل EMA21 یمیل بشکل إیجابی ، ویعمل کقاعدة اتجاه هیکلی أسفل مجموعات السعر ومجموعات الحجم. ✴ الخلاصة: یظل السوق سلیماً من الناحیة الهیکلیة طالما یبقى السعر أعلى من متوسط 21 یومًا. ⊣ ▦ Volume + EMA21 - (المجلد: 497.79 BTC - EMA21: 262 BTC): ∴ یتجاوز ارتفاع الحجم المتوسط المتداول ، مما یؤکد المشارکة المؤسسیة والشرعیة الانهیار. ✴ الخلاصة: توسیع مستوى الصوت یتحقق من حرکة الأسعار - لا توجد علامات على الاختلاف أو الإرهاق. ⊣ ▦ RSI + EMA9 - (RSI: 77.99 - EMA9: 68.49): ∴ دخلت RSI فی منطقة ذروة الشراء ، ومع ذلک ، فإن مسارها لا یزال أعلى وواسع نطاقه فوق تنعیمه band. ✴ الخلاصة: زخم صعودی استمر ؛ الظروف التی لا تقم بالقلق لا تنعکس بعد. ⊣ ▦ MACD - (9 ، 21 ، 9) + EMA's تجانس: ∴ MACD: 3،271.60 | إشارة: 2،013.81 | الاختلاف: +1،257.79 ؛ ∴ یتوسع خط MACD بشکل إیجابی على الإشارة ، مما یؤکد تسارع الزخم. ✴ الخلاصة: الإدانة الفنیة تفضل الاستمرار الصعودی ؛ لا تزال الإشارة نظیفة وغیر مشبعة. ⊣ ▦ ichimoku Cloud - (9 ، 26 ، 52 ، 26): price هو بشکل حاسم أعلى من منطقة Kumo Cloud - "Clear Sky" ؛ ∴ Senkou span A = 121،653.30 | Senkou Span B = 112،486.54 ؛ ∴ خطوط Tenkan و Kijun مرتفعة بشکل حاد ، مما یؤکد هیئة الاتجاه. ✴ الخلاصة: مقاومة الصفر أعلاه ؛ یدعم الإسقاط السحابی مزیدًا من التطویر التصاعدی. ⊣ 🜎 البصیرة الاستراتیجیة - أوراکل التقنیة: ∴ یتم محاذاة جمیع المؤشرات فی التقارب التوافقی rare ، وتوسع اتجاه الإشارة مع عدم وجود بنیة تتصدر التیار ؛ ∴ یوضح السوق سلوک موجة الدافع المتقدمة التی تدخل المرحلة الثانیة من التوسع ؛ ∴ یظل اللعب الاستراتیجی صعودیًا - یجب أن تکون عملیات التراجع ، إن وجدت ، ضحلة وسریعة. ⊣ 𓂀 التفسیر الرئوی الهیکلی: ∴ صاعدة هیکلیاً - تتقدم تکتیکیا ⊢ ⧉ cryptorvm dominvs · ⚜ Magister Arcanvm ⚜ · vox primordialis ⌬ - تبدأ الحکمة فی صمت. تتکشف الدقة فی الإستراتیجیة - ⌬ ⧉ ⊢
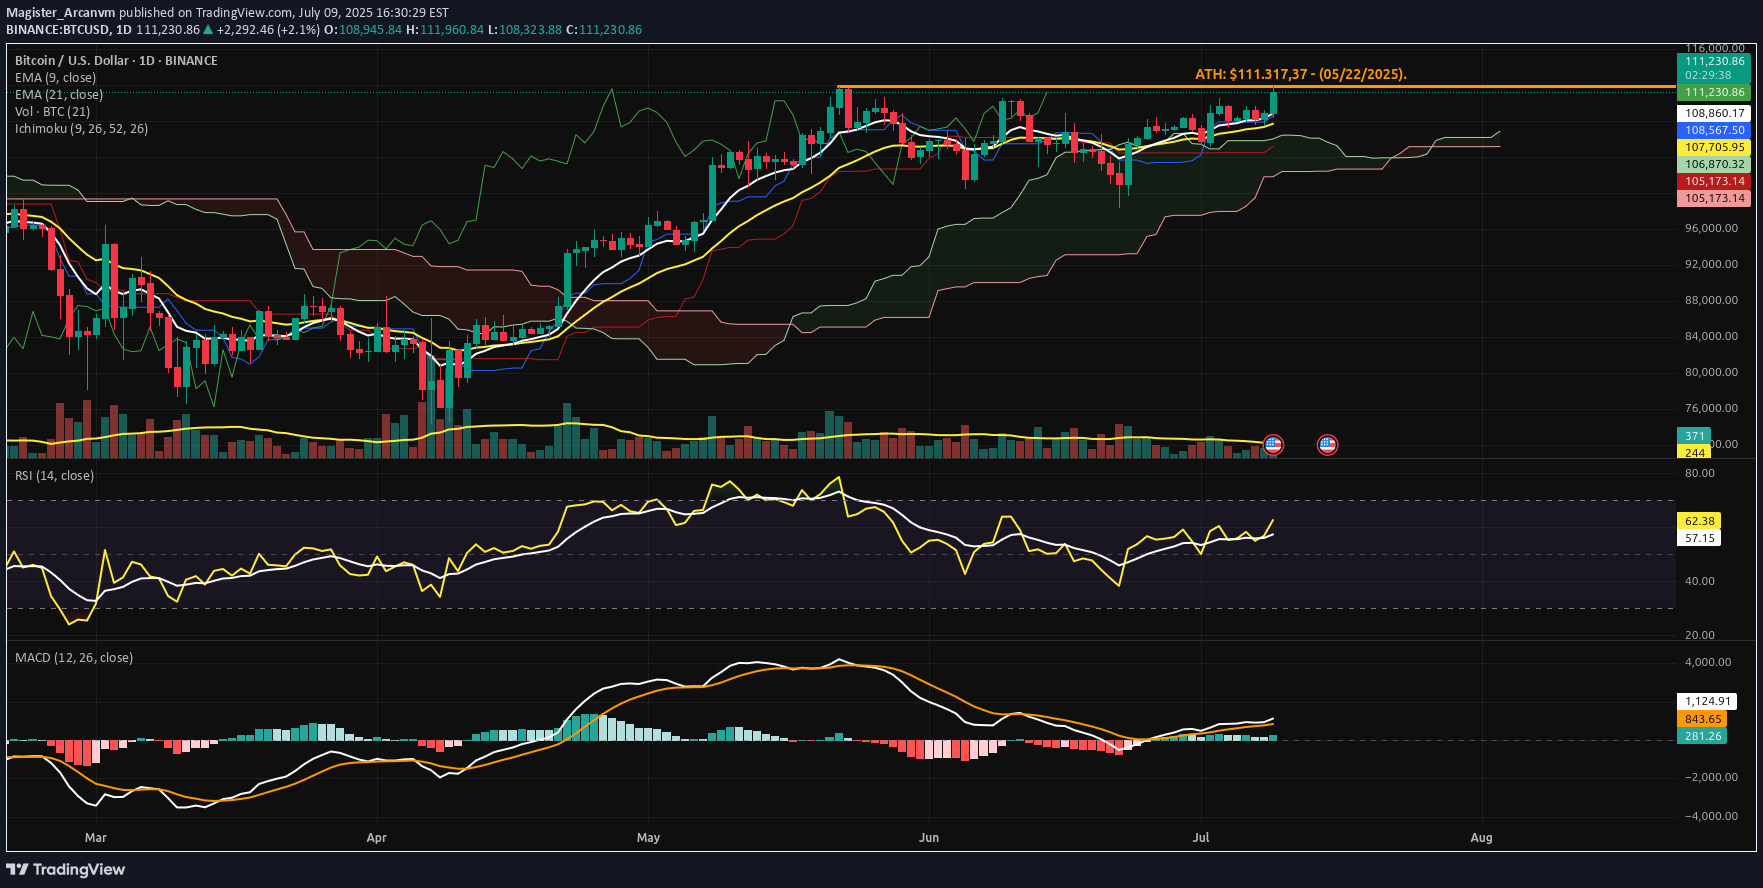
⊣⟁ BTC/USD - Binance - (الرسم البیانی: 1D) - (یولیو 09 ، 2025). الدعم مع المیل الإیجابی. الخلاصة: لا یزال الاتجاه الفوری سلیما ، مع دعم الزخم عند 108،767.5 دولارًا أمریکیًا. $ 107،663.85.⊢▦ Ichimoku Cloud - (Senkou A: $ 106،870.32 / Senkou B: $ 105،173.14): ∴ السعر بوضوح من Kumo ، مع توافق Tenkan / Kijun الصعودی ؛ ∴ lagging lans أعلى من کل من السعر والتأثیر على السحابة. یوفر الهیکل السحابی دعمًا بطبقات ما بین 106،800 دولار و 105،100 دولار. RSI - (61.33 دولارًا): ∴ RSI یرتفع ، حالیًا عند 61.33 ، لا یزال أقل من عتبة توقیت الشراء ؛ ∴ لا یوجد تباعد أو إشارة هبودیة موجودة ؛ EMA9 من RSI داعمة فی 56.94.✴ الخلاصة: الزخم صحیة وتسلق - تمتد إلى المرکز 70.⊢▦ MACD - (خط MACD: 251.71 / خط الإشارة: 836.26): crossover الصعود الأخیر مؤکد ؛ الرسم البیانی یتحول إلى إیجابیة بشکل متزاید ؛ macd یظهر MACD استئناف الاتجاه فی المرحلة المبکرة مع الزخم المتزاید. الخلاصة: مرحلة تجدید متجددة جاریة - یؤکد هیکل MACD القوة المستمرة. breakout.⊢🜎 البصیرة الاستراتیجیة - Oracle التقنیة: ∴ جمیع المؤشرات التقنیة فی محاذاة ؛ ∴ یتم دعم السعر من خلال الحجم ، EMA على المدى القصیر ، بنیة Ichimoku الصعودیة ، ونظیفة RSI /MACD Momentum ؛ ∴ السعر یقترب من (ATH - $ 111،317.37) وأی قرب مؤکد ، وخلفی من المجلد ، یمکن أن یکون هناک trigger a a a fibon. 117300 دولار). الذکاء الموجود على السلسلة - (المصدر: cryptoquant): ▦ تبادل التدفق المجموع - (جمیع التبادلات) - (13.4k Bitcoin): ∴ لا توجد مسامیر غیر طبیعیة - تظل التدفقات منخفضة تاریخیا. الخلاصة. انخفض بشکل حاد فی الأسابیع الأخیرة. الخلاصة: تقلص الإمداد الهیکلی - الممیزة الکلاسیکیة للتراکم. معدلات التمویل - (جمیع البورصات) - (+0.006 ٪): ∴ إیجابیة بعض الشیء ، بشکل جید ، داخل المنطقة المحایدة - لا توجد نوى. Spikes.✴ الخلاصة: یتم بناء المواقف بشکل منهجی - ولیس بشکل اندفاعی. البصیرة الاستراتیجیة - Oracle Oracle: ∴ لا یتم الدافع وراء الانهیار عن طریق الرافعة المالیة ، بل عن طریق التراکم الموضعی والانسحاب المؤسسی ؛ ∴ هذه البیئة تعکس الصعود السابق (ما قبل التوسعة) (بشکل ملحوظ فی أواخر 2020) ، عندما تم ترحیل المحفوظات بشکل مسطح ؛ جاریة. codicillus silentii - ملاحظة استراتیجیة: ∴ یظهر السوق صمتًا تامًا تحت السعر - لا یوجد تدفقات ، ولا تراکم مضاربة ؛ ∴ فقط أولئک الذین یتناسبون مع الإیقاع الأعمق یرون أن بناء الضغط داخل هذا الهیکل المضغوط ؛ ∴ لا یلاحظ المخطوطة شذوذات مزعجة ؛ الطاقة کامنة ، ولیست متفجرة - بعد. النطاق التکتیکی الحذر: ∴ الدعم الفوری: 108،767.55 دولار - (EMA9) ؛ ∴ الدعم الهیکلی: 107،663.85 دولار - (EMA21) - تکتیکیًا. تتکشف الدقة فی الإستراتیجیة - ⌬⧉⊢
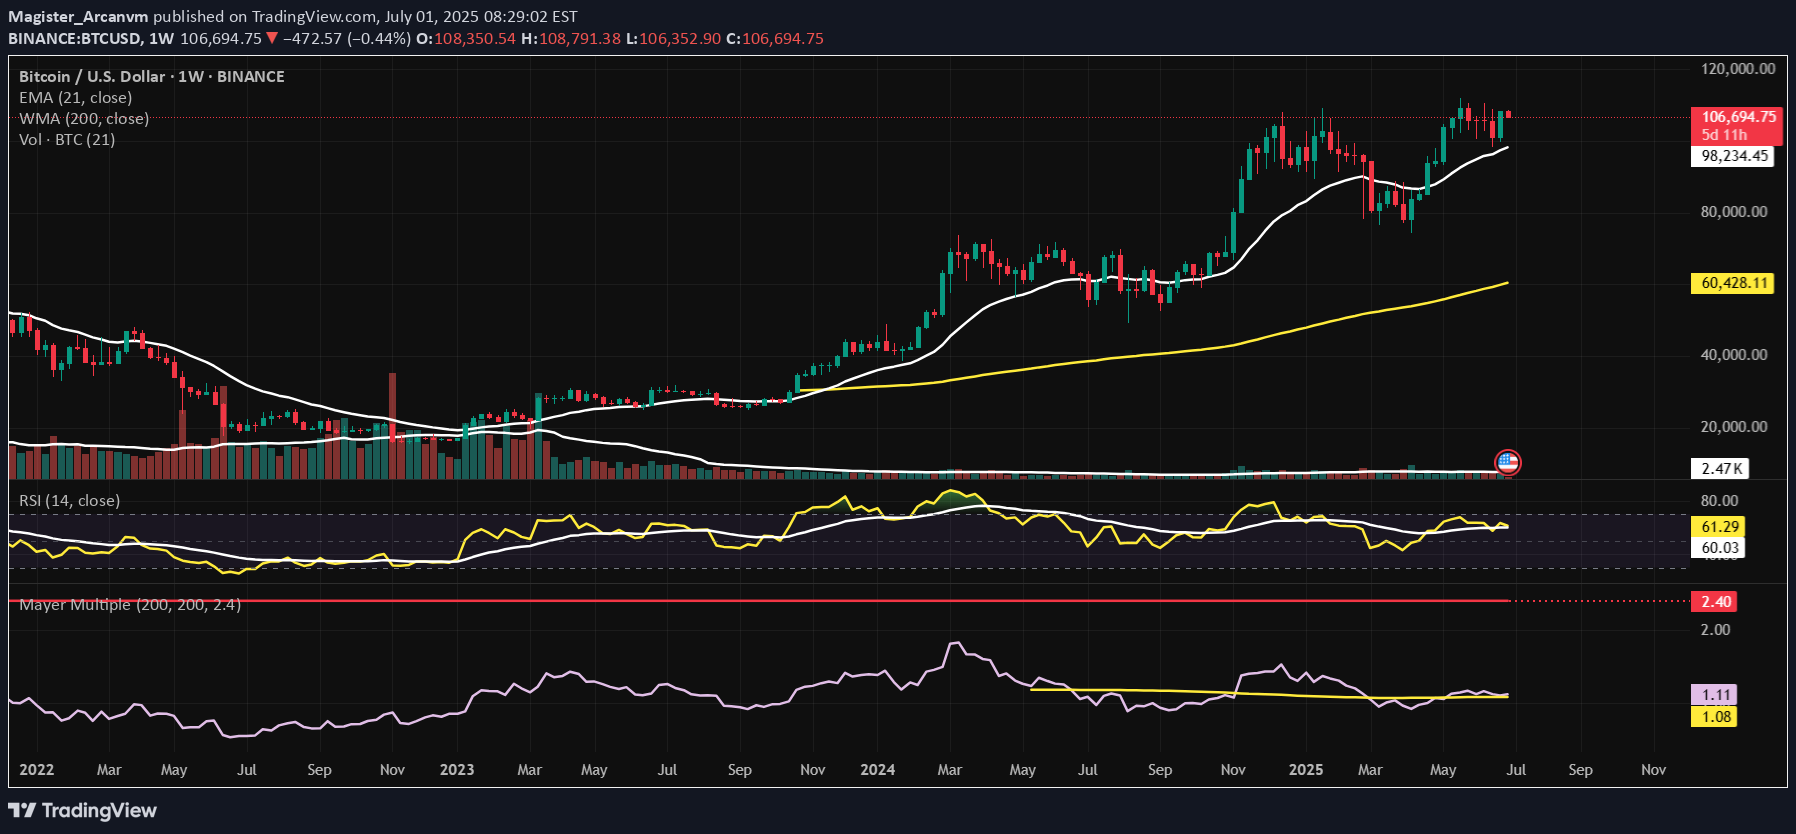
⊢⟁ BTC/USD – BINANCE – (CHART: 1W) – (Date: July 01, 2025).◇ Analysis Price: $106,464.00.⊢⨀ I. Temporal Axis – Strategic Interval – (1W):▦ EMA21 – ($98,213.17):∴ The EMA21 has provided dynamic mid-term support since early Q4 2024;∴ Recent pullbacks respected the line precisely, confirming its role as tactical trend anchor.✴ Conclusion: Tactical bullish posture maintained. Rejection above EMA21 signals controlled bullish continuation.⊢▦ Week Moving Average 200WMA – ($60,425.78):∴ The 200WMA continues its upward ascent, now surpassing the symbolic $60k level;∴ Price remains structurally elevated, approximately 76% above the WMA baseline, marking a strong long-term cycle support.✴ Conclusion: Structurally bullish. The 200WMA acts as a deep support; no signs of cyclical exhaustion.⊢▦ Volume + MA21:∴ Volume remains within normal bounds, with no explosive or capitulative behavior;∴ The 21-week average volume shows steadiness, confirming institutional absorption rather than speculative frenzy.✴ Conclusion: Price action is supported by consistent volume. There is conviction, not hype.⊢▦ RSI + EMA21 – (RSI: 61.01 | EMA: 60.00):∴ RSI remains stable above the 60-threshold, traditionally a bull-control zone;∴ The EMA21 on RSI sits just beneath it, reflecting sustainable momentum without overheating.✴ Conclusion: Momentum is alive and consistent. Pressure is not euphoric, but persistently positive.⊢▦ Mayer Multiple – (1.11):∴ The current Mayer Multiple (Price ÷ 200WMA) is at 1.11, far below critical cyclical warning zones;∴ Historical peaks formed above 2.4–3.2×, placing current readings in neutral-to-accumulative territory.✴ Conclusion: No signs of macro-top formation. Room for expansion remains open within cycle structure.⊢🜎 Strategic Insight – Technical Oracle:∴ Bitcoin maintains an elevated stance above all major structural supports;∴ No indicators suggest euphoric excess or terminal cycle behavior;∴ Momentum, structure, and volume all reflect the essence of a mature but breathing bull cycle, silently advancing.⊢∫ II. On-Chain Intelligence – (Source: CryptoQuant):▦ MVRV Ratio – (2.22):∴ The current MVRV remains below the historical danger zone of >2.5;∴ Price is elevated, but not euphoric - reflective of controlled structural ascent.✴ Conclusion: BTC sits in the upper-middle band of valuation. No top formation indicated, but vigilance required.⊢▦ Exchange Reserve – (All Exchanges – 2.4M BTC (new low):∴ Continuous decline in BTC held on exchanges since Q4 2022;∴ Signals that coins are being withdrawn to self-custody – typical of conviction-based accumulation.✴ Conclusion: Supply is drying from trading venues. This is fundamentally bullish and reduces short-term dump risk.⊢▦ Realized Cap – ($958B):∴ The realized capitalization is climbing in tandem with price - without flattening or divergence;∴ Indicates strong inflow of high-conviction capital setting new cost-bases.✴ Conclusion: Market is absorbing price increases via real buyer interest. Structural support is being rebuilt at higher levels.⊢▦ Short-Term Holder Realized Price & Profit/Loss Margin:∴ Profit margins are rising but remain beneath the historical 70% “euphoria line;”∴ No extreme deviation between spot price and realized price.✴ Conclusion: Profit-taking is occurring in equilibrium. No signs of unsustainable speculation.⊢▦ Spent Output Profit Ratio – (SOPR - 1.036):∴ Values above 1 indicate net selling at a profit;∴ However, the ratio is stable and modest – no spike.✴ Conclusion: Profitable selling is active, but not excessive. Market is cycling profits without panic or climax.⊢▦ Stablecoin Supply Ratio - (SSR – 17.6):∴ A high SSR means fewer stablecoins relative to BTC -> lower immediate buy-side liquidity;∴ This aligns with observed euro-stablecoin inflows and USD retreat.✴ Conclusion: Bitcoin price is rising without massive stablecoin inflow. Potential for future upside if SSR compresses.⊢🜎 Strategic Insight – On-Chain Oracle:∴ All six indicators converge on a structurally bullish;∴ Tactically stable market;∴ There is no evidence of blow-off top, exhaustion, or manic distribution;∴ Supply is retreating, valuation rising moderately, and profit cycles remain rational.⊢⧉ III. Contextvs Macro–Geopoliticvs – Interflux Economicvs:▦ Macro-Structural Narrative:∴ Bitcoin closed Q2 2025 with a +29.9% quarterly gain - (source: CryptoRank);∴ The rally is attributed to growing institutional adoption, bolstered by pro-Bitcoin policies of the Trump administration, including treasury-on-chain initiatives;∴ Macroeconomic tension around trade wars has eased, fueling upward movement in both BTC and the S&P 500, signaling synchronized risk-on appetite - (source: Coindesk).✴ Conclusion: The quarterly momentum reflects fundamental confidence, not speculative heat, Bitcoin is tracking macro cycles and policy favorability - not detaching from economic logic.⊢▦ Liquidity Rotation Signal:∴ While BTC saw a record monthly close above $106K in June, attention turned to the Euro, which surged ~4%, outperforming Bitcoin ~2.5% monthly gain - (source: Coindesk);∴ This signals capital movement out of the USD and into alternative monetary zones, including euro-pegged stablecoins, highlighting a shift in liquidity strategy. ✴ Conclusion: Bitcoin performance remains strong, but stablecoin flows suggest hedging against USD, and potential cross-currency dynamics now influence crypto markets more than in past cycles.⊢▦ Institutional Absorption:∴ Q2 2025 marked multiple treasury-scale Bitcoin purchases, the most notable was Strategy Inc.’s addition of $531 million in Bitcoin;∴ Coindesk reports increasing movement of aged coins, suggesting long-term holders are realizing profit selectively, not exiting fully;∴ Realized on-chain gains estimated around $2.4 billion, but SOPR and STH-P/L data show no speculative frenzy.✴ Conclusion: Institutional reaccumulation is active - distribution is rational, not euphoric, the market is cycling profits, not dissolving conviction.⊢▦ Sentiment & Policy Alignment:∴ Trump’s active endorsement of Bitcoin as a "strategic reserve instrument" has galvanized corporate treasuries and conservative capital;∴ Policy signals from the U.S. now mirror early El Salvador-like rhetoric but on a scaled geopolitical stage;∴ Meanwhile, legislative friction in the EU is softening, with euro-stablecoin flows confirming multi-jurisdictional bullish alignment.✴ Conclusion: Bitcoin is evolving from speculative asset into a political-economic monetary instrument. Its adoption curve is now influenced by state-level policy vectors, not just market actors.⊢⧈ Synthesis – Silent Codex Verdict:∴ Bitcoin’s Q2 expansion is rooted in structural convergence: (policy + macro easing + institutional inflows + on-chain discipline);∴ The asset is not overheated, and continues to mature within a globalized, politically aware framework;∴ The cycle breathes silently, with strength.⊢⌘ Codicillus Silentii – Strategic Note:∴ Resistance remains near $110K–112K, region of monthly closure highs;∴ EMA21 at $98K defines tactical floor - breach would signify shift in short-term conviction;∴ SSR at 17.6 suggests temporary stablecoin dryness, delaying momentum ignition.✴ Conclusion: Tactical posture is consolidative, awaiting macro or capital inflow catalyst.Upside remains open, but not yet inevitable.⊢𓂀 Stoic-Structural Interpretation:∴ Structurally Bullish – (Tactically Controlled);∴ Bitcoin maintains long-term structural dominance, anchored above the 200WMA and supported by rising Realized Cap and exchange outflows;∴ The RSI + EMA21 structure confirms active but non-euphoric momentum;∴ MVRV at 2.22 and SOPR at 1.03 reflect profitable cycling, not late-stage irrationality;∴ No blow-off volume or destabilizing divergence across timeframes.✴ Conclusion: Bitcoin is in mid-cycle ascension, exhibiting maturity, discipline, and policy-aligned backing. The structural bullish thesis is intact.⊢⧉⚜️ Magister Arcanvm – Vox Primordialis!𓂀 Wisdom begins in silence. Precision unfolds in strategy.⧉⊢
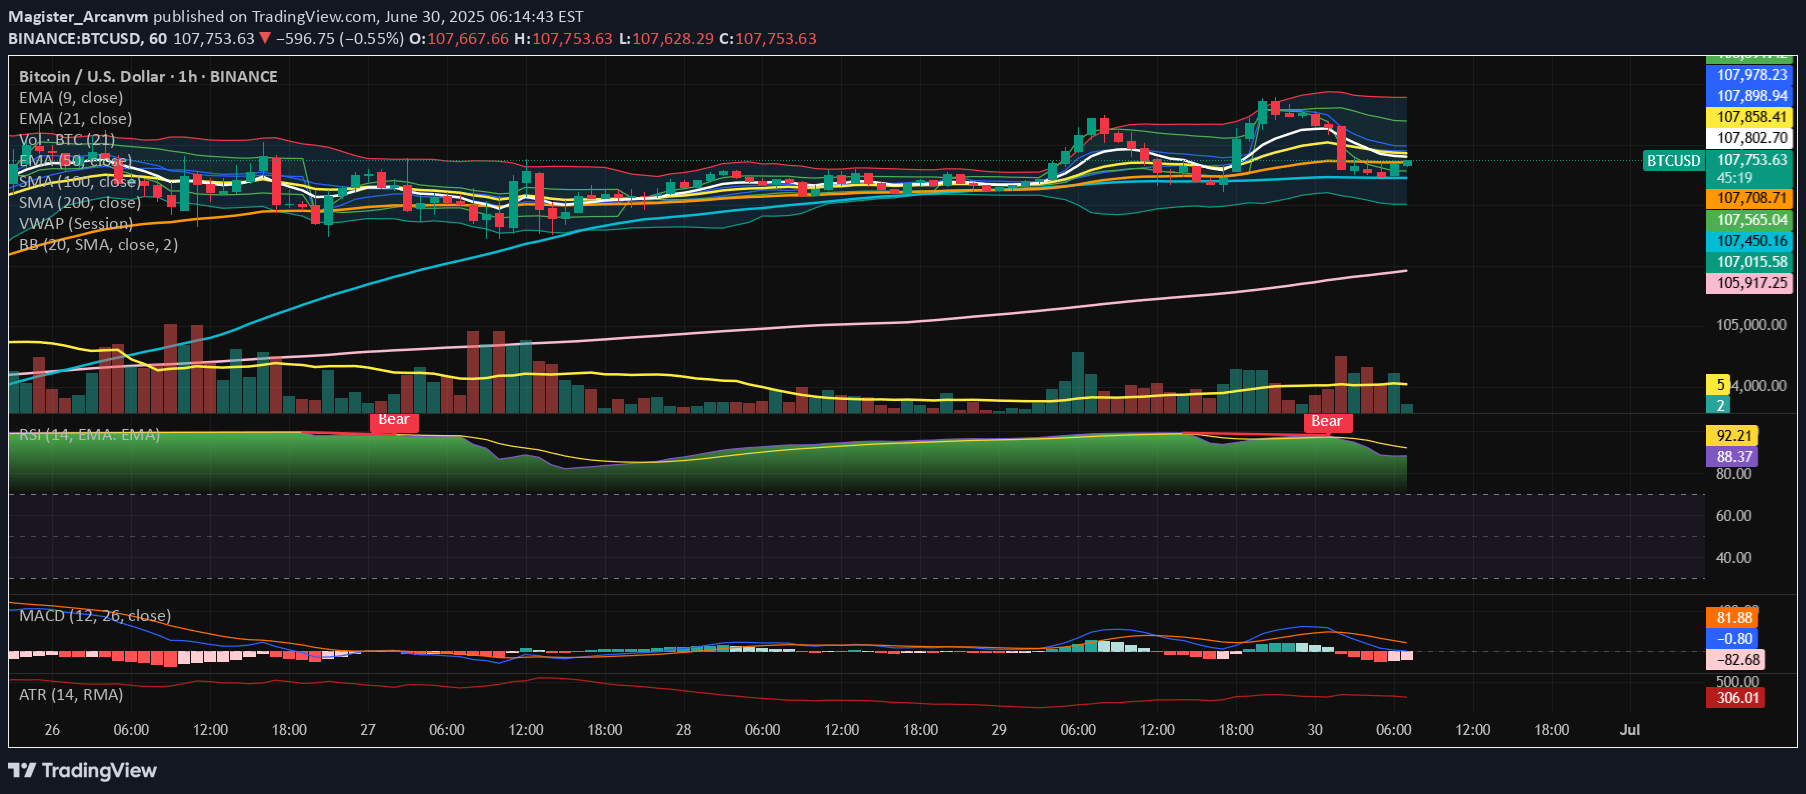
⊢⟁ BTC/USD – BINANCE – (CHART: 1H) – (Date: Jun 30, 2025).◇ Analysis Price: $107,599.99.⊢⨀ I. Temporal Axis – Strategic Interval – (1H):▦ EMA 9 – ($107,799.64):∴ The 9-period EMA remains above the current price, signaling downward rejection from short-term momentum line;∴ It recently crossed below the EMA21, reinforcing a weakening of bullish impulse.✴ Conclusion: EMA9 now acts as intraday resistance, confirming that immediate market strength has decayed and volatility expansion may continue unless reclaimed.⊢▦ EMA 21 – ($107,861.93):∴ EMA21 is sharply curved downward, validating loss of directional conviction from the previous bullish run;∴ This level aligns with a former consolidation zone, now potentially serving as a resistance pivot.✴ Conclusion: EMA21 confirms a short-term trend break, and the inability to reclaim this line would prolong corrective action.⊢▦ EMA 50 – ($107,703.87):∴ The EMA50 was breached decisively in the previous candle cluster, now positioned above price;∴ Slope is turning neutral-to-down, reflecting a transition from trend to turbulence.✴ Conclusion: EMA50 shift implies structural vulnerability in the intermediate frame, amplifying bearish tactical weight if no recovery emerges swiftly.⊢▦ SMA 100 – ($107,007.08):∴ SMA100 is currently positioned just below price, offering momentary support in case of further weakness;∴ Horizontal alignment indicates a pause or inflection zone, lacking directional strength.✴ Conclusion: SMA100 is a neutral-bullish support shelf, but could flip to active resistance if breached intraday.⊢▦ SMA 200 – ($105,890.26):∴ The SMA200 remains firmly upward-sloping and untouched — a sign of medium-trend resilience.∴ It defines the lower structural boundary for this time-frame.✴ Conclusion: SMA200 still holds bullish structural integrity, but if reached, it would represent a full reversion of recent strength.⊢▦ Volume + EMA 21 – (Current Vol: 5.31 BTC):∴ Volume shows an uptick during bearish candle clusters — indicative of active sell-side participation;∴ The EMA21 on volume reveals a rising slope, confirming that volatility is not passive, but driven by conviction.✴ Conclusion: Volume action supports the thesis of deliberate distribution, not merely rotational choppiness.⊢▦ VWAP (Session) – ($107,995.35):∴ Price has broken decisively below VWAP, showing institutional disengagement or absence of bid reinforcement;∴ VWAP now serves as magnetic resistance during any mean-reversion attempts.✴ Conclusion: VWAP position confirms that price is under fair-value, and current path is dominated by tactical sellers.⊢▦ Bollinger Bands – (Lower Band: $107,007.08):∴ Bands have widened, with price hugging the lower edge - a hallmark of volatility expansion;∴ Mean price ($107,895.00) sits significantly above spot, reinforcing downside pressure.✴ Conclusion: BB's suggest momentum breakdown, with price entering statistically stretched, yet uncorrected territory.⊢▦ RSI + EMA 9 – (RSI: 87.06 | EMA: 92.92):∴ RSI has sharply fallen from extreme overbought, but remains above the 70-level — reflecting ongoing exit from euphoric levels;∴ The EMA over RSI is crossing below, signaling loss of short-term strength and potential trend reversal.✴ Conclusion: RSI behavior implies a momentum peak has passed, though correction may still be in early phase.⊢▦ MACD – (MACD: 1.87 | Signal: -99.46 | Histogram: 101.33):∴ MACD histogram turned sharply positive following a steep drop, suggesting a potential pause in bearish acceleration;∴ Lines are converging but remain well below the zero axis - no bullish crossover yet.✴ Conclusion: MACD reflects oversold relief, but not reversal. Current state favors tactical caution rather than confidence.⊢▦ ATR (14, RMA) – (315.31):∴ ATR remains elevated, confirming ongoing high volatility and larger-than-average candle bodies;∴ This level sustains a risk zone scenario, where price swings may be unpredictable.✴ Conclusion: ATR indicates volatility expansion persists, further validating the need for defensive tactical posture.⊢🜎 Strategic Insight – Technical Oracle:∴ The technical constellation on the 1H chart reveals a clear breakdown of short-term bullish structure, now transitioning into a tactically bearish phase;∴ The rejection from VWAP and convergence of all EMA's above price confirm that any recovery must reclaim the 107.800–108.000 cluster to negate downside bias;∴ The current support rests on SMA100, yet its flat orientation and proximity to price suggest fragility, not strength. Meanwhile, SMA200 at 105.890 represents a more significant structural floor - its breach would mark a deeper tactical deterioration;∴ Volatility metrics (BB and ATR) indicate that the market is no longer coiled - it has entered expansion, and directional bias is momentarily controlled by sellers. RSI exiting overbought and MACD’s unresolved negative zone further support the thesis of ongoing correction, not mere pause;✴ Conclusion: In essence, the market has shifted into a correctional pulse, guided by structural breakdowns and expanding volatility. Tactical recoveries remain possible, but fragile and likely limited unless EMA's are reclaimed with force.⊢∫ II. On-Chain Intelligence – (Source: CryptoQuant):▦ Exchange Netflow Total – (All Exchanges) – (Last Recorded: +2.1K BTC):∴ Recent spike in netflow reveals a sudden influx of Bitcoin into centralized exchanges, marking the first positive divergence after a long series of outflows;∴ Such inflows historically precede tactical distribution events or profit-taking phases, especially following extended rallies.✴ Conclusion: Netflow confirms that holders are actively preparing to sell, giving real on-chain weight to the price rejection seen on the 1H chart.⊢▦ Short-Term Holder SOPR – (Latest Value: 1.012):∴ SOPR sits slightly above 1.0, but descending - indicating a transition from profit realization to potential break-even or loss selling;∴ If the trend continues and dips below 1.0, it marks capitulation from recent buyers — often a trigger for volatility spikes or local bottoms.✴ Conclusion: Current STH SOPR signals weakening conviction among short-term holders, supporting a corrective narrative rather than trend continuation.⊢🜎 Strategic Insight – On-Chain Oracle:∴ The on-chain substrate aligns precisely with the tactical weakness shown in the chart. The positive exchange netflow acts as a material indicator of sell-side readiness;∴ This inflow, breaking the historical trend of outflows, marks a shift in intent - from holding to liquidation;∴ Simultaneously, the Short-Term Holder SOPR sits on a critical edge. Its descent toward the 1.0 threshold implies that recent buyers are either approaching breakeven or beginning to capitulate;∴ This fragile posture typically amplifies local corrections, especially when coupled with rising volatility;∴ On-chain momentum no longer supports bullish continuation. Instead, it reflects hesitation, rotation, and distribution - all hallmarks of a short-term correction phase, in alignment with the temporal analysis;✴ Conclusion: The on-chain field confirms that the technical breakdown is not speculative - it is supported by active internal dynamics, signaling a pause or reversal in trend strength at a structural level.⊢⧈ Codicillus Silentii – Strategic Note:∴ The current H1 formation is a textbook example of post-euphoric fragility. What appeared as steady accumulation has now transitioned into a volatile de-leveraging phase. The confluence of bearish momentum, increased volume, and netflow reversal suggests the market is entering a tactical contraction zone;∴ No structural collapse is yet confirmed - but the absence of bullish defense at VWAP and EMA clusters denotes reduced resilience. Until these are reclaimed, all attempts at recovery must be viewed with caution.✴ Conclusion: Silence in structure signals preparation - not passivity. The next move shall emerge not from noise, but from the void left by exhaustion.⊢𓂀 Stoic-Structural Interpretation:∴ Structurally Bearish – Tactically Suspended;∴ The 1H chart shows a break below short-term momentum zones (EMA's, VWAP), confirming structural fragility;∴ Despite momentary support on SMA100, the loss of upward slope across the EMA's and RSI reversal validate a structural bearish bias;✴ Conclusion: Tactical direction remains suspended until one of two pivots is breached: either VWAP (~107.995) reclaimed, or SMA200 (~105.890) broken.⊢⧉⚜️ Magister Arcanvm – Vox Primordialis!𓂀 Wisdom begins in silence. Precision unfolds in strategy.⧉⊢⊢⧉ III. Contextvs Macro–Geopoliticvs – Interflux Economicvs - (Outlook – July 2025).⊢▦ US–China/UK Tariff Resolution Deadline – (July 9th):∴ The expiration of the 90-day tariff suspension looms, with only partial deals secured. Trump’s vague posture introduces volatility risk;∴ A lack of resolution may trigger reciprocal tariff escalations, dampening global liquidity and risk appetite.✴ Conclusion: Rising geopolitical friction may pressure speculative assets, delaying capital inflows into crypto markets during early July.⊢▦ US Tax Cuts + Spending Bill - (Trump Proposal):∴ Expected to inflate US national debt by $3.3T, nearing $36.2T, while lacking austerity backing;∴ Inflationary pressure may mount, but market reception depends on Senate reaction and Fed posture.✴ Conclusion: Fiscal expansion narrative could support medium-term Bitcoin hedging, though short-term uncertainty dominates.⊢▦ US Payroll Report – (July 3rd):∴ A critical macro trigger. A strong report may reinforce Fed neutrality or hawkishness, while a weak one may reintroduce easing expectations;∴ Risk assets, including Bitcoin, may respond sharply.✴ Conclusion: The payroll report will likely define the tactical tone for the first 10 days of July, shaping risk-on/off cycles.⊢
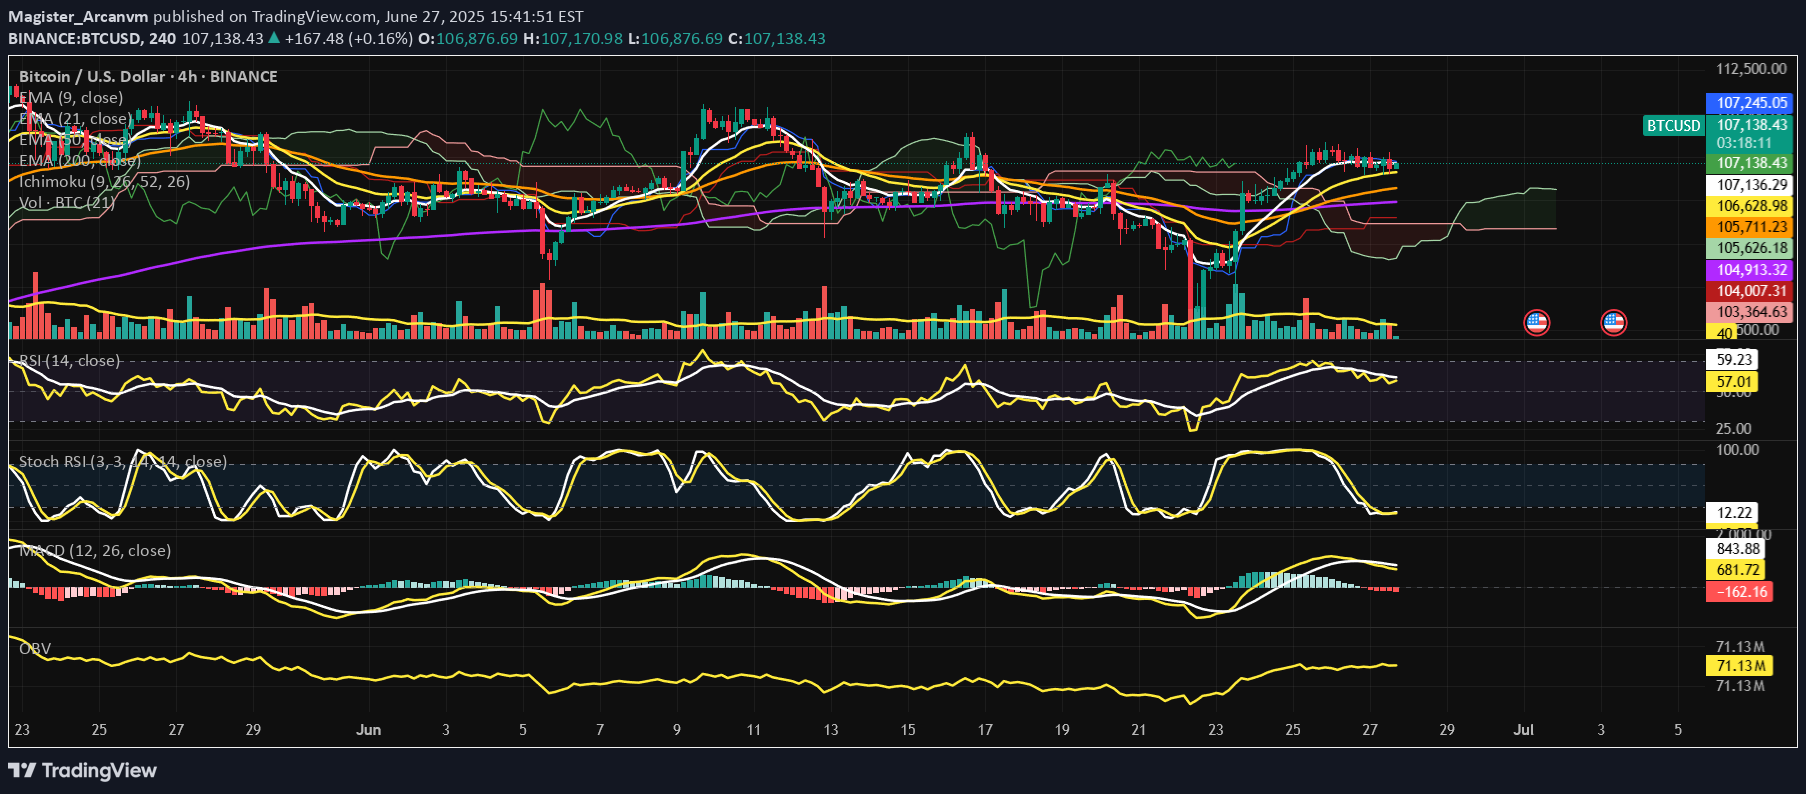
⊢⟁ BTC/USD – BINANCE – (CHART: 4H) – (June 27, 2025).⟐ Analysis Price: $106,840.15.⊢⨀ I. Temporal Axis – Strategic Interval – (4H):▦ EMA(9) – ($107,126.95):∴ Current price is slightly below the EMA(9), indicating the beginning of intraday buyer fatigue;∴ EMA(9) still curves upward, sustaining the recent bullish momentum, but showing signs of deceleration.✴️ Conclusion: Short-term strength is weakening; potential micro-shift in sentiment underway.⊢▦ EMA(21) – ($106,574.03):∴ EMA(21) acts as immediate dynamic support, now closely tested;∴ Still sloping upward, suggesting buyers are attempting to defend the structure.✴️ Conclusion: Tactical support remains intact - this is the battlefield line.⊢▦ EMA(50) – ($105,651.25):∴ Mid-range structure confirms trend stability as price remains well above the EMA(50);∴ EMA(50) direction remains mildly bullish, reinforcing medium-term control by buyers.✴️ Conclusion: Medium trend unshaken; pullbacks remain controlled within bullish context.⊢▦ EMA(200) – ($104,890.51):∴ Long-term baseline remains untouched, with price notably above;∴ The slope of EMA(200) is stable and slightly positive.✴️ Conclusion: Structural bullish foundation remains intact. No long-term threat detected.⊢▦ Ichimoku Cloud (9/26/52/26):∴ Price remains above the Kumo cloud; Tenkan and Kijun are aligned in bullish formation, though beginning to flatten;∴ Chikou Span remains free and clear above historical price — no conflict.✴️ Conclusion: Structure is still bullish, but compression in the cloud signals potential pause in directional conviction.⊢▦ Volume (BTC) + MA(21):∴ Volume sits below its 21-period moving average, indicating waning buyer participation;∴ No breakout or capitulation candle - sentiment is reserved.✴️ Conclusion: Lack of conviction - volume confirms indecision and pause in impulse.⊢▦ RSI + EMA9 – (RSI: 54.78 / EMA9: 59.70):∴ RSI curves downward from the upper-neutral zone - momentum is retreating;∴ RSI has crossed below its EMA(9), which typically signals fading bullish strength.✴️ Conclusion: Momentum has weakened - buyers are hesitating.⊢▦ Stoch RSI – (K: 9.72 / D: 10.22):∴ Oscillator is deep in the oversold region, preparing a bullish cross;∴ No confirmation of reversal yet - early signal.✴️ Conclusion: Setup for potential rebound exists, but signal remains unconfirmed.⊢▦ MACD – (MACD: 725.17 / Signal: 883.72 / Histogram: –158.55):∴ MACD histogram turns increasingly negative, suggesting decay in momentum;∴ Though MACD line remains above signal, curvature favors a bearish crossover soon.✴️ Conclusion: Momentum fading; risk of technical crossover if weakness persists.⊢▦ OBV – (71.13M):∴ OBV is flat and shows no divergence, suggesting balanced pressure;∴ Movement remains parallel to EMA21, confirming neutrality.✴️ Conclusion: Volume flow is not supporting a continuation; neutral.⊢🜎 Strategic Insight – Technical Oracle:∴The structure remains bullish at the macro and medium levels;∴ As evidenced by EMA alignment and Ichimoku posture. However, momentum signals are fading, and the current 4H candle lacks conviction;∴ A breakout requires stronger volume and RSI reacceleration - until then, the tactical stance is suspended.⊢∫ II. On-Chain Intelligence – (CryptoQuant):▦ 1. Exchange Netflow Total – (All Exchanges):∴ Current readings show net outflows dominating, indicating coins moving out of exchanges - typically interpreted as holding behavior and bullish bias;∴ No recent spike in inflows that would suggest imminent selling pressure or dump risk.✴️ Conclusion: Exchange behavior is structurally bullish - environment favors accumulation.⊢▦ 2. Exchange Stablecoins Ratio – (All Exchanges):∴ The ratio remains low and stable, meaning high stablecoin reserves vs. Bitcoin on exchanges - suggesting potential buying power in standby;∴ No spike in the ratio - no immediate conversion from stablecoins into Bitcoin.✴️ Conclusion: Stablecoins on standby confirm latent demand - supportive for bullish continuity if triggered.⊢▦ 3. Funding Rates – (All Exchanges):∴ Funding is positive but mild, indicating long interest, yet not overheated;∴ No excessive leverage detected - absence of speculative imbalance.✴️ Conclusion: Derivatives market supports a healthy uptrend with no signs of crowd euphoria.⊢▦ 4. Estimated Leverage Ratio – (All Exchanges):∴ Leverage ratio remains within neutral bounds, not expanding aggressively;∴ Suggests market is currently not dominated by overleveraged positions.✴️ Conclusion: The structure is stable - no systemic risk from forced liquidations.⊢▦ 5. Taker Buy/Sell Ratio – (All Exchanges):∴ The ratio is slightly above 1.0 - meaning more aggressive buying than selling, but without dominance;∴ Reinforces sentiment of cautious buying, not yet euphoric.✴️ Conclusion: Taker flow confirms moderate bullish sentiment, no reversal pressure.⊢🜎 Strategic Insight – On-Chain Oracle:∴ On-chain metrics align with structural bullishness;∴ Netflows, leverage, and taker activity all support continuation;∴ Importantly, stablecoin ratios signal dry powder remains available, meaning the market holds the potential energy for further upside - if volume and technical confirmation align.⊢⧈ Codicillus Silentii Strategic Note:∴ In the discipline of silence, one waits as price tests its dynamic zone. The wise act after structure, not inside uncertainty;∴ The chain speaks in whispers. Smart liquidity waits. The structure is armed - but momentum requires ignition. Not fear, not hope - signal.⊢𓂀 Stoic-Structural Interpretation:∴ Structurally Bullish - (Tactically Suspended);∴ The core architecture remains intact, but the absence of volume and declining oscillators justify a suspended stance for entry;∴ On-chain and chart-based structures are aligned in bullish posture, but technical indicators remain in a suspended tactical phase. Awaiting breakout or deeper pullback for positioning.⊢▦ Tactical Range Caution:∴ Watch $106,574 (EMA21) and $105,651 (EMA50) for reactive buying;∴ Below $104,890 (EMA200) - structure weakens;∴ Upside breakout requires volume reclaim above $107,330;∴ Resistance: $107,330 / $108,200.⊢⧉⚜️ Magister Arcanvm (𝟙⟠) – Vox Primordialis!𓂀 Wisdom begins in silence. Precision unfolds in strategy.⧉⊢
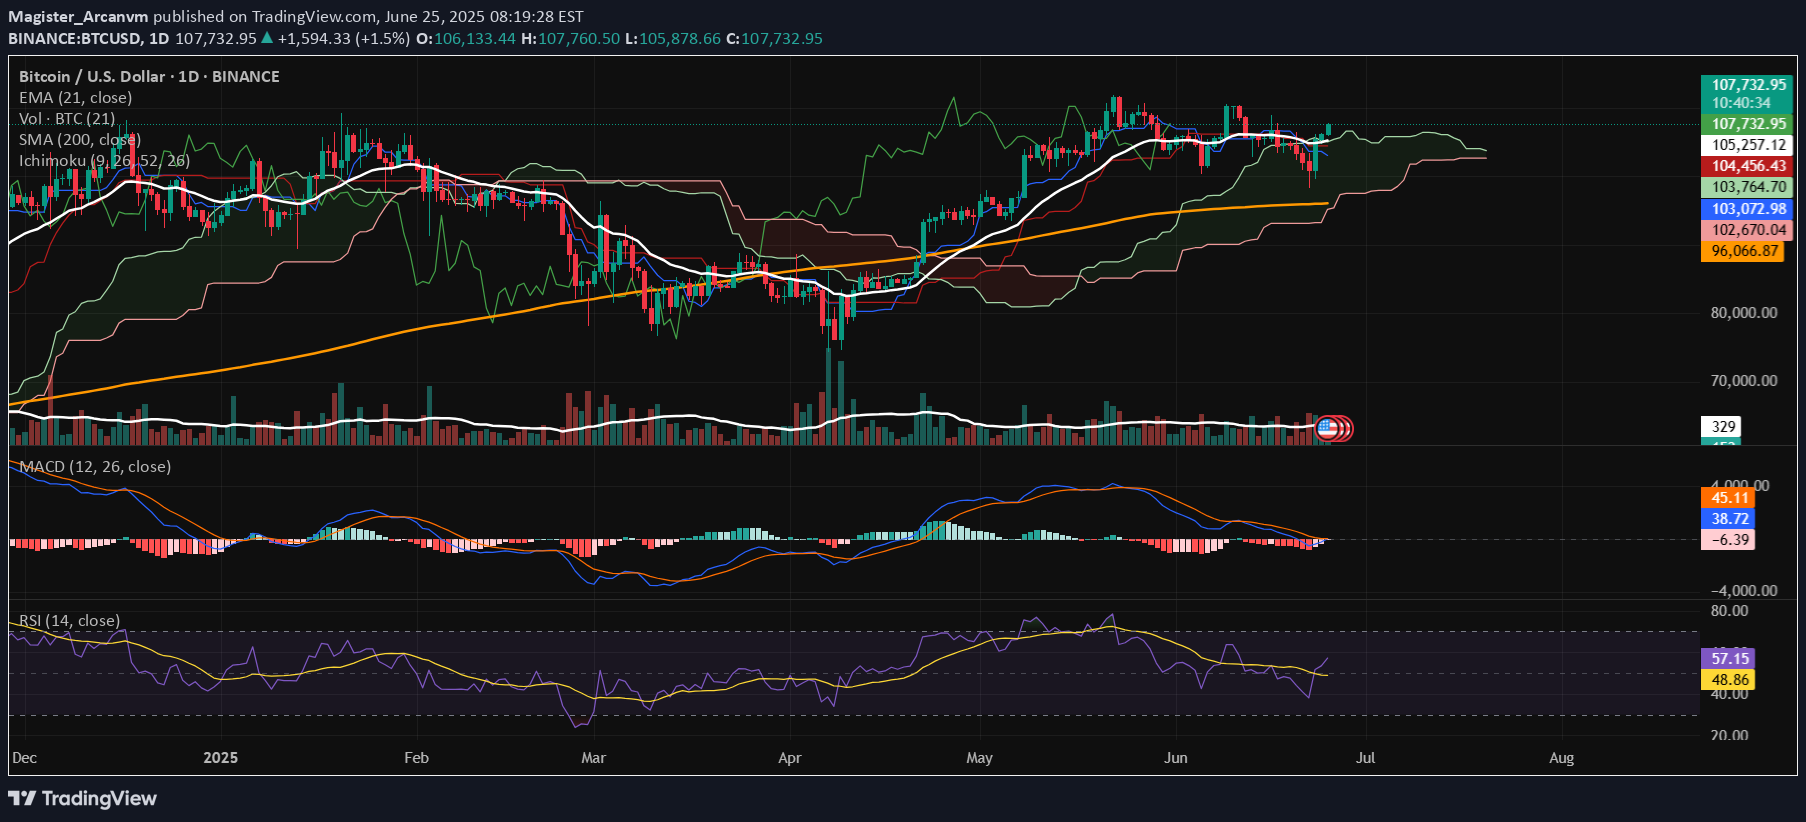
⊢⟁ BTC/USD – BINANCE – (CHART: 1D) – (Jun 25, 2025).⟐ Analysis Price: $107,191.94.⊢⨀ I. Temporal Axis – Strategic Interval – (1D):▦ EMA21 – ($105,207.93):∴ Price has reclaimed EMA21 decisively after testing below;∴ EMA21 maintains upward slope, indicating reactivation of short-term bullish sentiment;∴ Dynamic support now resides at ~$105.2K.✴️ Conclusion: EMA structure favors bullish continuation while price holds above.⊢▦ SMA200 – ($96,064.16):∴ SMA200 remains strongly upward sloped, untouched since March 2024;∴ Long-term momentum remains firmly bullish;∴ No contact with SMA200 confirms macro support far below.✴️ Conclusion: Structural support intact; macro uptrend fully confirmed.⊢▦ Ichimoku Cloud – ($103,065.53 / $104,456.43):∴ Price positioned above Kumo; bullish structure remains intact;∴ Kijun-sen ($104,456.43) and Tenkan-sen ($103,065.53) both flat, signaling short-term consolidation;∴ Chikou Span approaches historical resistance zone; Span A and B flattening.✴️ Conclusion: Bullish trend preserved, but lacking forward thrust; potential stagnation if breakout fails.⊢▦ Volume (MA21) – (~129 BTC):∴ Current volume ~128.73 BTC, slightly under the moving average;∴ No breakout volume confirmation despite recent price thrust;∴ Weak volume expansion reduces reliability of short-term breakout.✴️ Conclusion: Momentum requires validation through volume escalation.⊢▦ MACD – (-4.44 / 36.48 / -40.92):∴ Histogram contracting upward, bearish momentum fading;∴ MACD Line (-4.44) still below Signal Line (36.48);∴ No confirmed bullish crossover, but compression phase active.✴️ Conclusion: Latent bullish reversal potential; not yet validated.⊢▦ RSI – (55.95):∴ RSI reclaimed level above 50, positioning in neutral-bullish zone;∴ RSI MA at 48.78 confirms momentum shift;∴ Positive slope suggests rising momentum, but lacks steepness.✴️ Conclusion: Momentum entering constructive zone, still not impulsive.⊢🜎 Strategic Insight – Technical Oracle:∴ Structure remains technically bullish with constrained momentum;∴ Indicators are aligned toward continuation, yet breakout conviction is hindered by insufficient volume and pending oscillator confirmation;∴ Short-term path is upward-biased, conditional on validation.⊢∫ II. On-Chain Intelligence – (Source: CryptoQuant):▦ Exchange Netflow – (All Exchanges):∴ Netflow remains negative on 7-day average;∴ Sustained outflows indicate strategic accumulation or self-custody preference;∴ No evidence of large-scale exchange inflows that signal distribution.✴️ Conclusion: Net capital migration continues favoring off-exchange security; bullish underlying tone.⊢▦ Stablecoin Supply Ratio (SSR):∴ SSR near 17.5 indicates relatively low stablecoin dominance;∴ Reduced buying power vs Bitcoin implies cooling short-term demand;∴ Historically elevated SSR levels precede price consolidations or local tops.✴️ Conclusion: Stablecoin reserves insufficient for sustained upward pressure; caution warranted.⊢▦ Exchange Whale Ratio – (All Exchanges):∴ Whale Ratio near 0.59 denotes moderate large-holder activity;∴ Ratio not in critical zone (>0.7), yet above accumulation range (<0.4);∴ Potential soft distribution behavior if ratio trends upward.✴️ Conclusion: Mixed signal - no panic, but latent whale presence requires monitoring.⊢▦ Miner Reserve:∴ Miner balances steadily declining over past 30 days;∴ Consistent outflows suggest controlled selling behavior;∴ No aggressive miner dumping detected.✴️ Conclusion: Miner pressure exists but remains tactical and non-destructive.⊢▦ Long-Term Holder SOPR (LTH-SOPR):∴ Metric above 1.0 indicates long-term holders are in profit and realizing gains;∴ No sharp spike detected, suggesting rational distribution;∴ Structure consistent with healthy bull cycle mechanics.✴️ Conclusion: Profit-taking underway in equilibrium; not a signal of panic.⊢▦ Funding Rate – (Futures):∴ Funding mildly positive (~0.002–0.004%), reflecting long positioning bias;∴ Rates remain low, indicating lack of overcrowded trades;∴ No sign of speculative overheating in derivatives.✴️ Conclusion: Derivatives sentiment is constructive, not euphoric; room for further upside exists.⊢🜎 Strategic Insight – On-Chain Oracle:∴ On-chain metrics reflect a stable yet cautious accumulation phase; ∴ Absence of sell pressure, tempered long-term holder realization, and moderate derivative sentiment suggest foundation for continuation, albeit with reduced immediate force;∴ Confirmation must align with price and volume.⊢⧉ III. Contextvs Macro–Geopoliticvs – Interflux Economicvs:▦ Geopolitical Axis – Middle East Ceasefire:∴ Ceasefire between Israel and Iran eased global tension, triggering flight from commodities into risk assets;∴ Brent crude declined over -2.5% following truce reports, reducing inflationary pressure;∴ However, geopolitical fragility remains - peace is provisional, not structural;✴️ Conclusion: Tactical relief observed; no systemic safety guaranteed.⊢▦ Monetary Policy – US Federal Reserve Outlook:∴ Jerome Powell signals continued rate hold, citing sticky inflation and fragile global equilibrium;∴ Futures markets price ~20% chance of July cut, ~60% for September;∴ Bond yields retreating (2Y at ~3.78%), suggesting easing expectations embedded;✴️ Conclusion: Macro liquidity conditions marginally favorable to crypto; policy risk remains asymmetric.⊢▦ Equities & Global Sentiment – Dow Jones / Nasdaq Futures:∴ Dow Futures flat (~+0.02%), Nasdaq Futures rise on tech optimism;∴ Equity markets supported by decline in oil, stabilization in rates, and AI-sector inflows;∴ No VIX spike – volatility subdued;✴️ Conclusion: Macro-risk appetite firming up, enhancing crypto’s speculative appeal.⊢▦ Derivatives Behavior & Institutional Flow:∴ Option markets show accumulation of BTC calls at 108K–112K strike zones;∴ Futures funding positive but low, consistent with healthy long-side conviction;∴ No structural imbalance detected;✴️ Conclusion: Derivatives support scenario of moderate bullishness without speculative overreach.⊢⌘ Codicillus Silentii – Strategic Note:∴ Temporal architecture remains bullishly aligned, but lacks velocity – movement is present without ignition;∴ On-chain metrics reveal quiet distribution among long-term holders, yet without aggressive miner displacement or exchange flooding;∴ Market tension is suspended in a state of equilibrium – neither contraction nor breakout assert dominion;∴ The asymmetry of opportunity lies dormant, awaiting conviction in participation and volume.⊢𓂀 Stoic-Structural Interpretation:▦ Structurally Bullish – Tactically Suspended:∴ Price structure above EMA21 and SMA200 confirms preservation of macro uptrend – foundation remains unbroken;∴ Miner reserve reduction and stable LTH-SOPR suggest controlled realization, not structural weakness;∴ However, Ichimoku flattening and low volume expansion indicate stalling momentum, lacking breakout substance.⊢▦ Tactical Range Caution:∴ Whale Ratio mid-levels and SSR elevation highlight proximity to potential resistance exhaustion;∴ MACD crossover remains unconfirmed; RSI enters constructive zone without strength – reactionary rather than initiative-based;∴ Until volume and oscillator confirmation emerge above $108.2K, posture remains protective and selective.⊢⧉⚜️ Magister Arcanvm (𝟙⟠) – Vox Primordialis!𓂀 Wisdom begins in silence. Precision unfolds in strategy.⧉⊢⊢⟁ BTC/USD – Strategic Risk Framework & Market Structure Assessment (1D) – Jun 25, 2025.⊢⧉ III. Contextvs Macro–Geopoliticvs – Interflux Economicvs - (Expanded):▦ Geopolitical Axis – Ceasefire Reaction & Fragility:∴ BTC surged from ~$98K to above $107K following initial reports of a ceasefire between Iran and Israel;∴ Despite market relief, ceasefire violations were observed within 48 hours, confirming the fragile and temporary nature of the détente;∴ Risk-on sentiment remains conditional, tethered to geopolitical stability that is not yet structurally grounded.✴️ Conclusion: Relief rally evident, but sustainability remains exposed to renewed conflict headlines.(Source: The Block, Business Insider, Barron’s).⊢▦ Monetary Policy – Federal Reserve Demeanor:∴ Jerome Powell affirmed a data-dependent stance, signaling no urgency to cut rates despite moderated inflation prints;∴ CME FedWatch Tool implies ~20% probability of a July cut, ~60% for September - aligning with risk asset resilience;∴ Bond market reflects this positioning with 2Y and 10Y yields declining ~12 bps over past 5 sessions.✴️ Conclusion: Liquidity support intact; Fed posture provides non-hostile environment for crypto continuation.(Source: Coindesk, InfoMoney).⊢▦ Derivatives Flow – Liquidation Mechanics & Institutional Stance:∴ ~$350M in short liquidations occurred during the recent spike - reflecting a short-squeeze rather than euphoric positioning;∴ Funding rates remain positive but not excessive; implied volatility subdued, no evidence of irrational exuberance;∴ Bitcoin call options clustered at $108K–$112K, showing upside appetite with contained leverage.✴️ Conclusion: Institutional and derivatives positioning favors moderate continuation, not parabolic impulse.(Source: Coindesk, The Block).⊢▦ Crypto Sector Breadth – CoinDesk 20 / Miner Dynamics:∴ CoinDesk 20 index rose +0.5%, with BCH +6.0%, SOL +1.8%, and BTC +2.1%, suggesting broad-based participation;∴ Mining profitability up ~18% in May, hash rate rising modestly; North American miners now hold 26.3% dominance;∴ Health of the network and miner margins both structurally positive; selling pressure from miners remains low.✴️ Conclusion: Ecosystem-wide support in both asset price action and infrastructure metrics.(Source: Coindesk).⊢⧈ Codicillus Silentii – Strategic Note:∴ Bitcoin holds above structural levels while macro, on-chain, and geopolitical metrics align toward cautious optimism;∴ The ceasefire catalyzed immediate risk-on behavior, yet its fragility imposes a ceiling of restraint;∴ Market structure shows no speculative excess - sentiment is reactive, not manic;∴ Technicals, capital flows, and macro posture define a suspended state of potential - ignition awaits decisive trigger.⊢⧉⚜️ Magister Arcanvm (𝟙⟠) – Vox Primordialis!𓂀 Wisdom begins in silence. Precision unfolds in strategy.⧉⊢
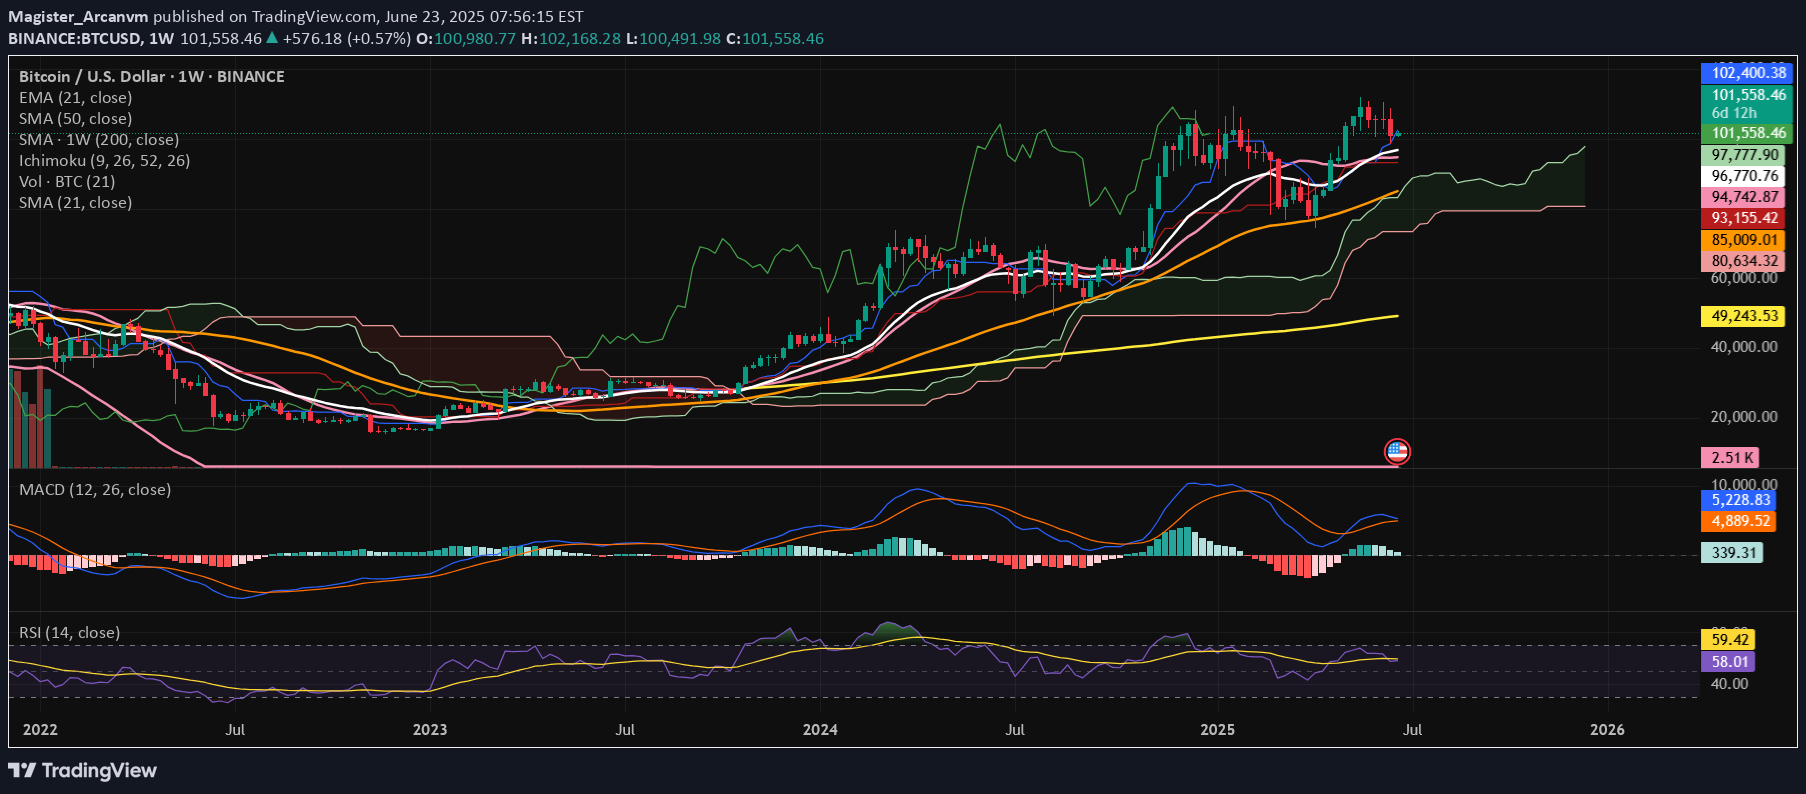
⊢⟁ BTC/USD – BINANCE – (CHART: 1W) – (Date: June 23, 2025).⟐ Analysis Price: $101,226.28.⊢⨀ I. Temporal Axis – Strategic Interval – (1W):▦ EMA21 – ($96,740.64):∴ Price remains above the 21EMA, confirming bullish structural integrity in medium trend;∴ The slope of EMA21 remains positive, reinforcing sustained market momentum;∴ Most recent candle printed a higher low above the 21EMA, reaffirming it as dynamic support.✴️ Conclusion: The 21EMA upholds the current cycle's bullish engine - it is the first invalidation level for any mid-term reversal.⊢▦ SMA50 – ($85,002.38):∴ SMA50 sits considerably below current price, reflecting distance from mean reversion zones;∴ Market remains extended, but no immediate signs of pullback toward this structural level;∴ The last interaction with SMA50 was in late 2023, when it confirmed trend resumption.✴️ Conclusion: SMA50 defines the core mid-range support - no threat to it unless a breakdown accelerates below EMA21.⊢▦ SMA200 – ($49,241.87):∴ SMA200 remains deeply below market, showing that the macro bullish structure remains unchallenged;∴ Distance from SMA200 reflects the strength and maturity of this cycle’s trend;∴ Long-term investors remain in profit and structurally supported.✴️ Conclusion: No macro breakdown as long as price stays well above SMA200 - the secular bull phase is intact.⊢▦ Ichimoku Cloud – (Kumo, Tenkan, Kijun, Chikou Span):∴ Price is trading clearly above the Kumo (cloud), showing sustained bullish dominance;∴ Tenkan-sen and Kijun-sen lines are positively stacked, with Tenkan still leading;∴ Chikou Span is above price and cloud, confirming long-term bullish alignment.✴️ Conclusion: All Ichimoku components confirm bullish control - weakening only upon Tenkan/Kijun flattening or bearish cross.⊢▦ MACD – (MACD: 318.17 | Signal: 4,884.24):∴ MACD line is far below the signal line, though attempting a bottoming curve;∴ The histogram remains red but with decreasing amplitude - bearish momentum is fading;∴ No bullish crossover yet - momentum remains negative but weakening.✴️ Conclusion: MACD suggests waning bearish cycle, but no official reversal signal until crossover and histogram neutralization.⊢▦ RSI + EMA21 – (RSI: 57.71 | RSI EMA: 59.39):∴ RSI remains in bullish territory above 50, although flattening below its EMA;∴ No bearish divergence observed yet - RSI is consolidating;∴ If RSI reclaims its EMA, strength may resume; if rejected again, loss of momentum may escalate.✴️ Conclusion: RSI reflects structural strength, but cautious momentum - monitoring RSI/EMA relationship is critical.⊢▦ Volume + SMA21 – (Vol: 2.51K):∴ Weekly volume remains below the 21-week average, indicating weakening participation;∴ Last few candles show declining volume despite price stability - possible distribution;∴ Absence of buyer aggression may limit further upside near-term.✴️ Conclusion: Volume suggests lack of conviction - momentum exists, but crowd participation is thinning.⊢🜎 Strategic Insight – Technical Oracle:∴ Bitcoin's weekly chart maintains bullish structural posture above all key moving averages, yet momentum indicators reflect hesitation;∴ The Ichimoku system confirms trend dominance, but MACD and RSI signal that internal strength is not expanding - only sustaining;∴ Volume contraction reveals market indecision or fatigue, potentially foreshadowing consolidation or rebalancing phases;∴ Despite no structural breakdown, directional conviction is lacking - further upside demands renewed volume and momentum alignment.⊢☍ II - GAP CME – BTC1! – Chicago Mercantile Exchange:▦ Previous CME Close – ($99,640.00) + Spot Opening Binance – ($100,980.77):∴ A clear upside gap is present between the institutional close and the retail spot open, measuring approximately $1,340.77, thus defining a latent Magnet Zone for downward pullback;∴ This CME gap forms a critical vacuum range between $99.640 and $100.980, which will likely act as a liquidity reabsorption zone if spot retraces;∴ No immediate fill has occurred, suggesting current bullish momentum persists despite latent imbalance.∴ The latest weekly CME candle closes with a smaller real body and a pronounced upper wick — a classical signal of buy-side exhaustion below macro resistance ($102K–$103K);∴ Despite the weakening thrust, no breakdown has yet been printed — the bullish structure remains technically intact above previous weekly lows;∴ Volume prints are non-expansive, indicating lack of conviction among institutional buyers at this level — vigilance is required.✴️ Conclusion: The CME structure reveals a latent institutional gap magnet to the downside, with price now suspended above an untested imbalance. The technical structure remains constructive but fragile. Further confirmation from the spot market will determine whether continuation or reversion will manifest in the coming cycle.⊢∫ III. On-Chain Intelligence – (Source: CryptoQuant):▦ Exchange Inflow Total – (All Exchanges):∴ A recent spike in total Bitcoin inflows aligns directly with the $101K zone, signaling increased movement of coins from wallets to exchanges;∴ Historically, such inflow spikes near local tops indicate preparation for distribution or profit-taking by large holders;∴ Current inflow levels exceed previous consolidation phases, amplifying the risk of sell pressure activation.✴️ Conclusion: The market is facing elevated short-term risk from exchange-bound liquidity — inflows confirm readiness to sell into strength.⊢▦ Spot Taker CVD – (Cumulative Volume Delta, 90-Day) – (All Exchanges):∴ The 90-day CVD curve shows clear flattening and early reversal near resistance, indicating a shift in taker behavior;∴ Passive sell-side absorption appears to dominate, reducing the strength of buy-side aggression;∴ Price action continues upward while CVD retreats, forming a classic hidden distribution divergence.✴️ Conclusion: CVD reveals taker exhaustion - without resurgence in spot demand, current price levels are vulnerable to sell-offs.⊢▦ Exchange Inflow Mean – (7-Day Moving Average) – (All Exchanges):∴ The 7DMA of inflow mean remains elevated, suggesting sustained presence of large-sized transactions heading toward exchanges;∴ This behavior often precedes institutional or strategic sales, especially when combined with total inflow spikes;∴ No decline in the inflow mean implies continuous preparation for short-term distribution.✴️ Conclusion: Elevated inflow mean confirms that whales and large actors are preparing or executing strategic exits.⊢▦ Funding Rate – (All Exchanges):∴ Rates across global derivatives platforms remain slightly positive but without speculative imbalance;∴ The neutral-positive range suggests cautious optimism among traders - not overleveraged, but not afraid;∴ No signs of euphoric long build-ups, which reduces liquidation risk but weakens breakout fuel.✴️ Conclusion: A neutral funding environment supports consolidation, not explosive upside — no immediate directional conviction.⊢▦ Funding Rate – (Binance):∴ Binance-specific funding remains tightly aligned with global averages, reflecting no localized distortion;∴ Positive, stable readings indicate low speculative friction, but also lack of trend-defining aggression;∴ Historical patterns show that breakout rallies typically require a surge in funding rate — not present yet.✴️ Conclusion: Binance traders are balanced - not short-squeezed nor euphoric - bias remains neutral until imbalance arises.⊢▦ Realized Price – Short-Term Holders (MVRV-STH) – (~$47.5K):∴ Price trades far above the STH realized price, indicating most recent buyers are deep in unrealized profit;∴ This dynamic historically increases the chance of sell pressure at resistance zones, especially when inflows are high;∴ No downward compression or convergence - suggesting strength remains, but realization is a persistent risk.✴️ Conclusion: STH's are exposed to high profit levels - the market is primed for potential realization, but not structural weakness.⊢🜎 Strategic Insight – On-Chain Oracle:∴ Exchange-based signals (Inflow Total, Mean) confirm active preparation for sell-side flow;∴ Spot aggression is fading as per CVD divergence, weakening breakout thesis despite strong price structure;∴ Neutral funding and passive miner/on-holder behavior reflect structural balance - not panic, not euphoria.✴️ Conclusion: The market rests in a zone of speculative tension - directionally undecided, but operationally sensitive to imbalance triggers.⊢⌘ Codicillus Silentii – Strategic Note:∴ The temporal structure signals resilience, but lacks expansion - technical relief exists without structural thrust;∴ On-chain flows unveil transactional friction at current levels, with capital cycling toward liquidity zones (exchanges);∴ Market energy is neither compressed for breakout nor collapsed into capitulation - a state of coiled hesitation;∴ Asymmetry remains hidden within equilibrium - vigilance, not movement, defines the moment.⊢𓂀 Stoic-Structural Interpretation:▦ Structurally Neutral:∴ Price holds above key macro supports (EMA21, SMA50), confirming preservation of the bullish superstructure;∴ Long-term holder behavior and miner flows remain passive - structural integrity is undisturbed;∴ However, no active thrust or trend validation emerges - the system sustains but does not ascend.⊢▦ Tactically Cautious:∴ Exchange inflows and CVD divergence signal short-term vulnerability near key resistances;∴ Technical indicators (MACD, RSI, Volume) reflect a condition of deceleration - momentum is reactionary, not foundational;∴ Until price reclaims volume-weighted levels with confirmation, the posture remains defensive and watchful.⊢⧉⚜️ Magister Arcanvm (𝟙⟠) – Vox Primordialis!𓂀 Wisdom begins in silence. Precision unfolds in strategy.⧉⊢
إخلاء المسؤولية
أي محتوى ومواد مدرجة في موقع Sahmeto وقنوات الاتصال الرسمية هي عبارة عن تجميع للآراء والتحليلات الشخصية وغير ملزمة. لا تشكل أي توصية للشراء أو البيع أو الدخول أو الخروج من سوق الأوراق المالية وسوق العملات المشفرة. كما أن جميع الأخبار والتحليلات المدرجة في الموقع والقنوات هي مجرد معلومات منشورة من مصادر رسمية وغير رسمية محلية وأجنبية، ومن الواضح أن مستخدمي المحتوى المذكور مسؤولون عن متابعة وضمان أصالة ودقة المواد. لذلك، مع إخلاء المسؤولية، يُعلن أن المسؤولية عن أي اتخاذ قرار وإجراء وأي ربح وخسارة محتملة في سوق رأس المال وسوق العملات المشفرة تقع على عاتق المتداول.